

Question: from pratical time series forecasting with r book. chapter 7 7.5 Problems 1. Analysis of Canadian Manufacturing Workers Work-Hours: The time series plot in Figure
from pratical time series forecasting with r book. chapter 7 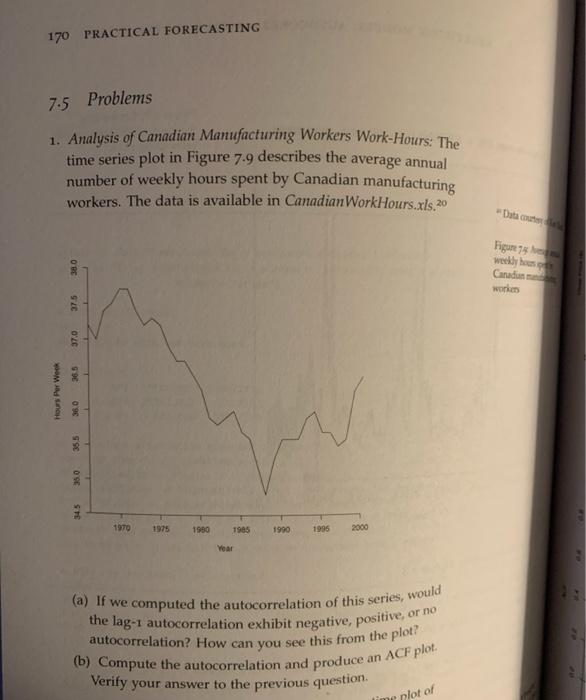
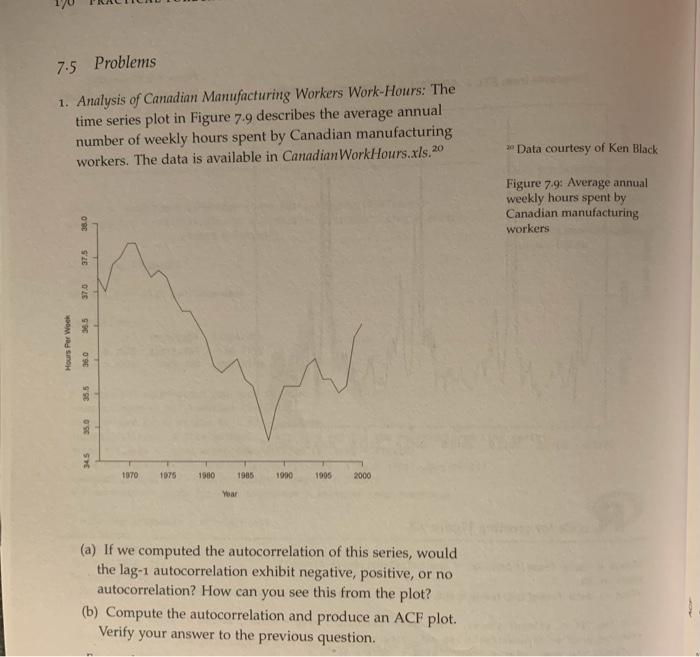
7.5 Problems 1. Analysis of Canadian Manufacturing Workers Work-Hours: The time series plot in Figure 7.9 describes the average annual number of weekly hours spent by Canadian manufacturing workers. The data is available in Canadian WorkHours.xls. 20 * Data courtesy of Ken Black Figure 7.9: Average annual weekly hours spent by Canadian manufacturing workers 380 37.5 70 305 Hours Per WOOR USC SSE Ose 345 1970 1075 1900 1985 1900 1905 2000 Year (a) If we computed the autocorrelation of this series, would the lag-1 autocorrelation exhibit negative, positive, or no autocorrelation? How can you see this from the plot? (b) Compute the autocorrelation and produce an ACF plot. Verify your answer to the previous
Step by Step Solution
There are 3 Steps involved in it
1 Expert Approved Answer
Step: 1 Unlock

Question Has Been Solved by an Expert!
Get step-by-step solutions from verified subject matter experts
Step: 2 Unlock
Step: 3 Unlock