

Question: From Production and Operations Management class. Please solve it ASAP with proper explanation. Give Six samples of ni= 20 observations were obtained. The sample means
From Production and Operations Management class. Please solve it ASAP with proper explanation.
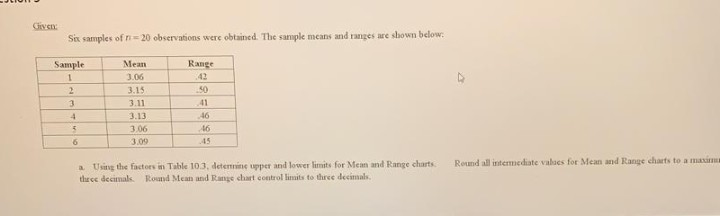
Give Six samples of ni= 20 observations were obtained. The sample means and ranges are shown below: Sample Range 1 2 3 4 Mean 3.06 3.15 3.11 3.13 3.06 3.09 50 41 .46 16 .-15 5 6 Round all intermediate values for Mean and Range charts to a man a. Using the factors Table 10.3. determine upper and lower limits for Men and Range charts the decimals Round Mean and Range chart control limits to three decimals
Step by Step Solution
There are 3 Steps involved in it
1 Expert Approved Answer
Step: 1 Unlock

Question Has Been Solved by an Expert!
Get step-by-step solutions from verified subject matter experts
Step: 2 Unlock
Step: 3 Unlock