

Question: From ratios calculated in the table shown below, analyse the profitability and efficiency of Bach for the relevant years. Consider sector (industry) averages when formulating
From ratios calculated in the table shown below, analyse the profitability and efficiency of Bach for the relevant years. Consider sector (industry) averages when formulating your analysis.
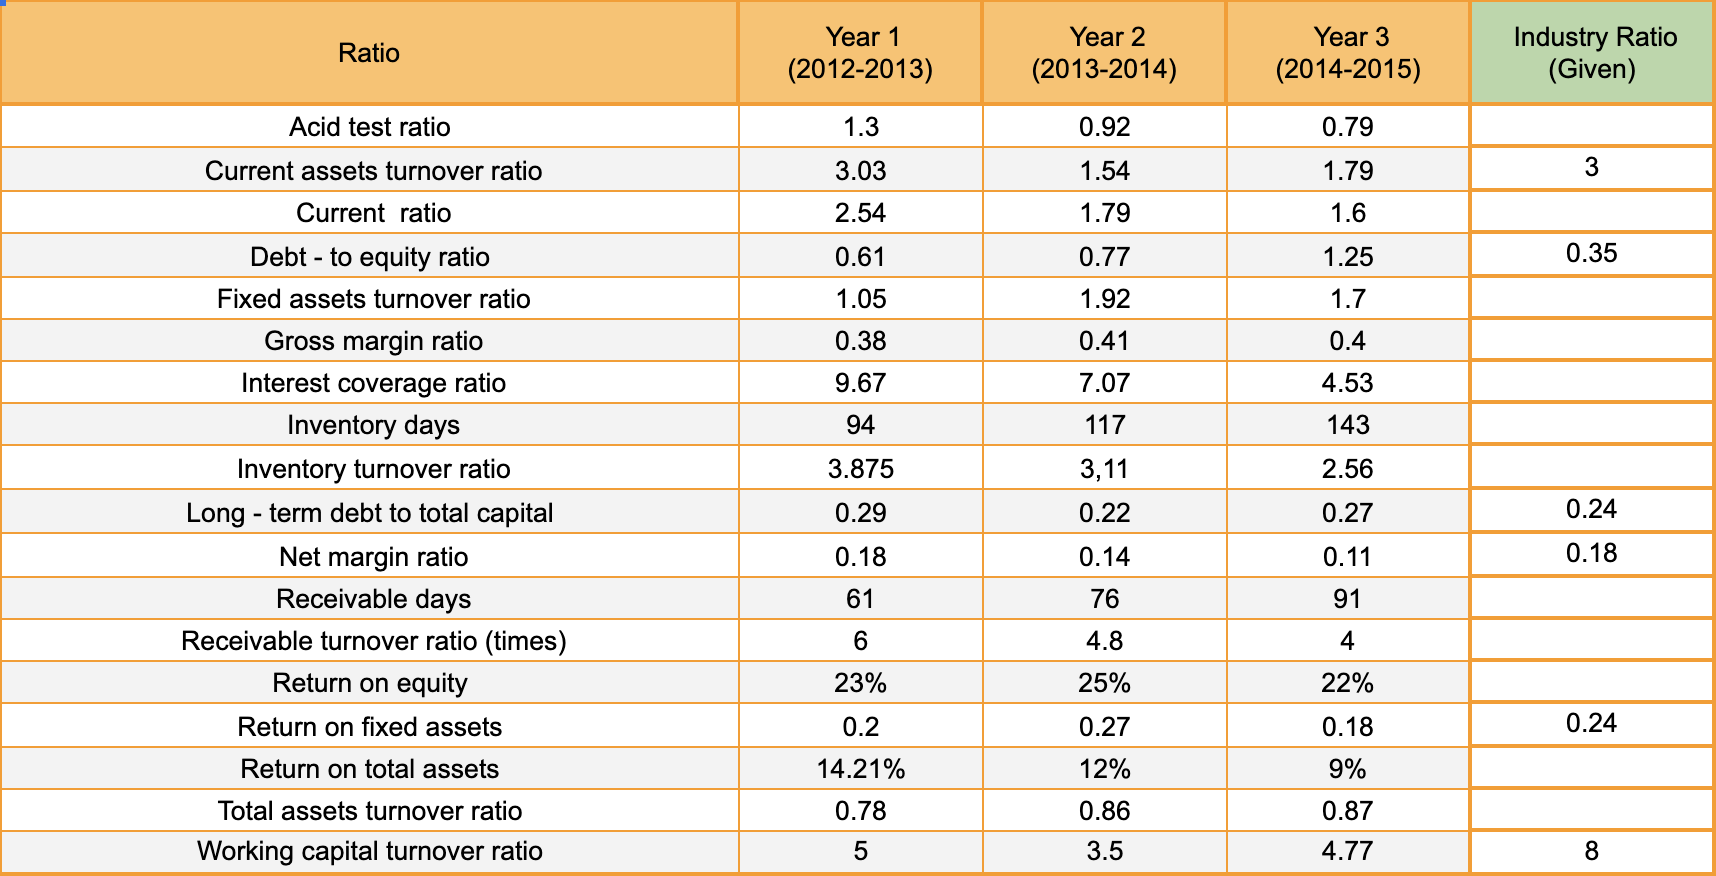
Ratio Year 1 (2012-2013) Year 2 (2013-2014) Year 3 (2014-2015) Industry Ratio (Given) Acid test ratio 1.3 0.92 0.79 Current assets turnover ratio 3.03 1.54 1.79 3 Current ratio 2.54 1.79 1.6 0.61 0.77 0.35 1.25 1.7 1.05 1.92 0.38 0.41 0.4 9.67 7.07 4.53 94 117 143 3.875 3,11 2.56 Debt - to equity ratio Fixed assets turnover ratio Gross margin ratio Interest coverage ratio Inventory days Inventory turnover ratio Long - term debt to total capital Net margin ratio Receivable days Receivable turnover ratio (times) Return on equity Return on fixed assets 0.29 0.22 0.27 0.24 0.18 0.14 0.11 0.18 61 76 91 6 4.8 4 23% 25% 22% 0.2 0.18 0.24 0.27 12% Return on total assets 14.21% 9% 0.78 0.86 0.87 Total assets turnover ratio Working capital turnover ratio 5 3.5 4.77 8
Step by Step Solution
There are 3 Steps involved in it

Get step-by-step solutions from verified subject matter experts