

Question: from the above mentioned study provide the conclusions Integer 2. EXPERIMENTAL SETUP The sample data has been downloaded from www.kaggle.com competition is Walmart Recruiting -
from the above mentioned study provide the conclusions
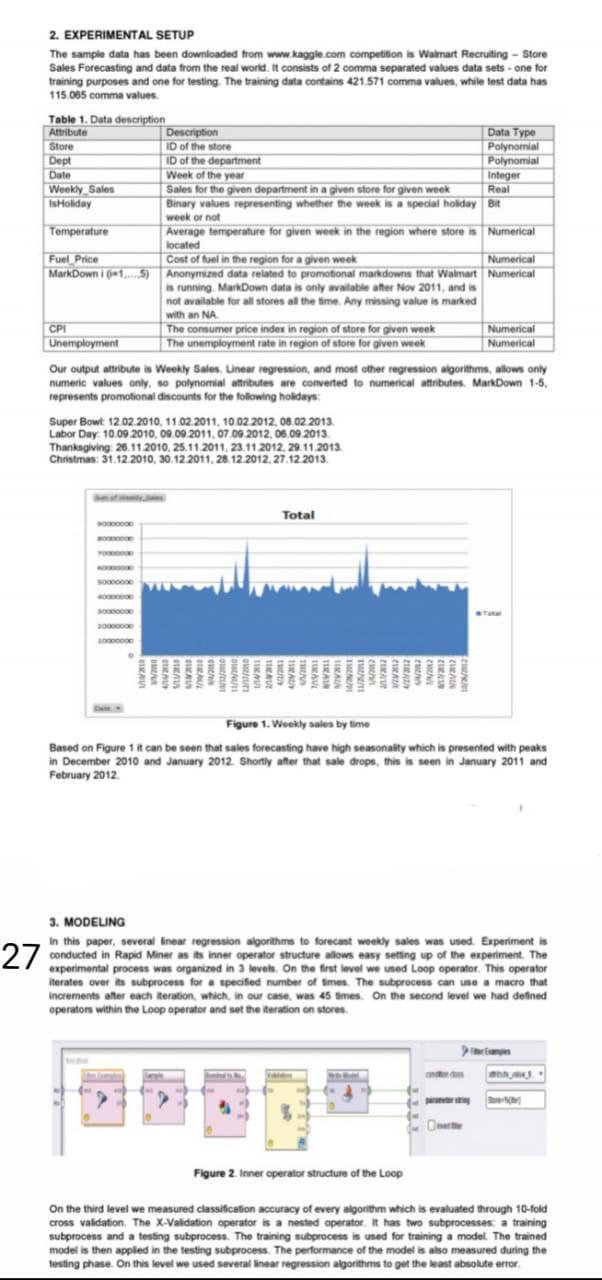
Integer 2. EXPERIMENTAL SETUP The sample data has been downloaded from www.kaggle.com competition is Walmart Recruiting - Store Sales Forecasting and data from the real world. It consists of 2 comma separated values data sets - one for training purposes and one for testing. The training data contains 421.571 comma values, while test data has 115005 comma values Table 1. Data description Attribute Description Data Type Store ID of the store Polynomial Dept ID of the department Polynomial Date Week of the year Weekly Sales Sales for the given department in a given store for given week Real Is Holiday Binary values representing whether the week is a special holiday Bit week or not Temperature Average temperature for given week in the region where store is Numerical located Fuel Price Cost of fuel in the region for a given week Numerical MarkDown (-1,5) Anonymszed data related to promotional markdowns that Walmart Numerical is running MarkDown data is only available after Now 2011, and is not available for all stores all the time. Any missing value is marked with an NA CPI The consumer price index in region of store for given week Numerical Unemployment The unemployment rate in region of store for given week Numerical Our output attribute is Weekly Sales. Linear regression, and most other regression algorithms, allows only numeric values only. so polynomial attributes are converted to numerical attributes. MarkDown 1-5, represents promotional discounts for the following holidays Super Bowl 12.02.2010, 11.02.2011, 10 02 2012, 08 02 2013 Labor Day: 10.09.2010, 09.09.2011 07.09.2012, 06.09.2013 Thanksgiving: 20.11.2010 25.11.2011 23.11 2012 29.11.2013 Christmas: 31.12.2010. 30.12.2011. 28.12.2012 27.12.2013 Total 000 200000 Figure 1. Weekly sales by time Based on Figure 1 it can be seen that sales forecasting have high seasonality which is presented with peaks in December 2010 and January 2012. Shortly after that sale drops, this is seen in January 2011 and February 2012 3. MODELING In this paper, several linear regression algorithms to forecast weekly sales was used Experiment is conducted in Rapid Miner as its inner operator structure allows easy setting up of the experiment. The experimental process was organized in 3 levels. On the first level we used Loop operator. This operator iterates over its subprocess for a specified number of times. The subprocess can use a macro that Increments after each iteration, which, in our case, was 45 times. On the second level we had defined operators within the Loop operator and set the iteration on stores -) 4" Figure 2 toner operator structure of the Loop On the third level we measured classification accuracy of every algorithm which is evaluated through 10-fold cross validation. The X-Validation operator is a nested operator It has two subprocesses a training subprocess and a testing subprocess. The training subprocess is used for training a model. The trained model is then applied in the testing subprocess. The performance of the model is also measured during the testing phase. On this level we used several linear regression algorithms to get the least absolute errorStep by Step Solution
There are 3 Steps involved in it
1 Expert Approved Answer
Step: 1 Unlock

Question Has Been Solved by an Expert!
Get step-by-step solutions from verified subject matter experts
Step: 2 Unlock
Step: 3 Unlock