

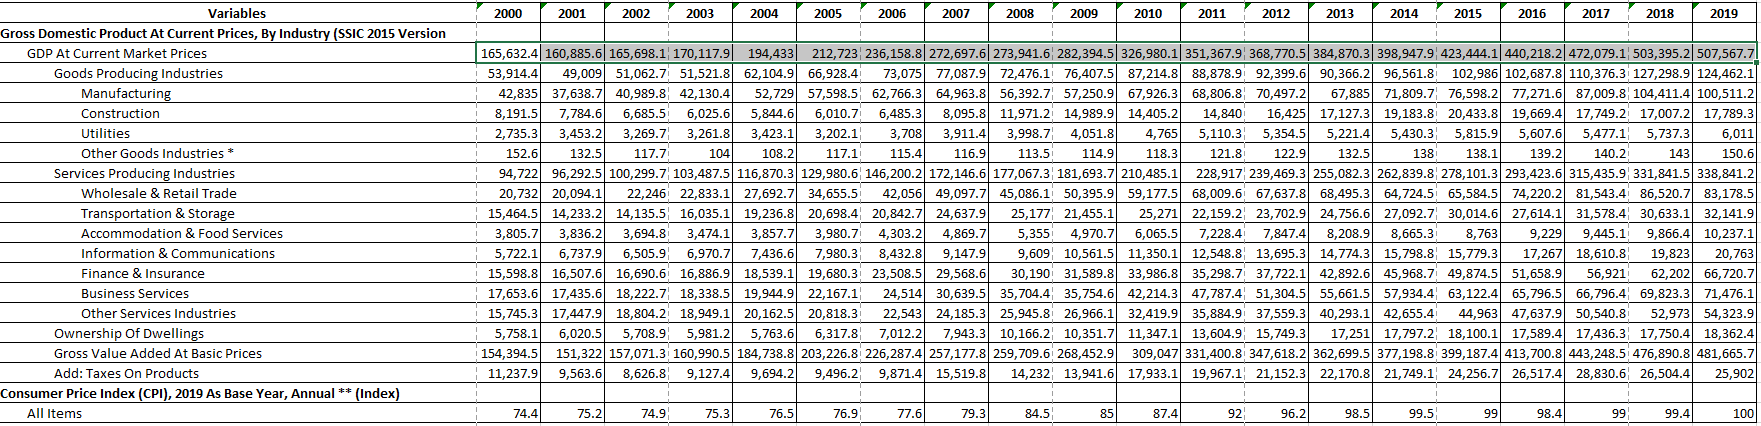
Question: From the data attached below. How would I plot a graph to show the RGDP and inflation rate over the period 2000-2019 in excel?
From the data attached below. How would I plot a graph to show the RGDP and inflation rate over the period 2000-2019 in excel?
Step by Step Solution
There are 3 Steps involved in it
1 Expert Approved Answer
Step: 1 Unlock

Question Has Been Solved by an Expert!
Get step-by-step solutions from verified subject matter experts
Step: 2 Unlock
Step: 3 Unlock