

Question: ! From the data below, calculate the three-day simple moving average. Fill in the Buy or Sell Signal column for this trading indicator. Then, calculate
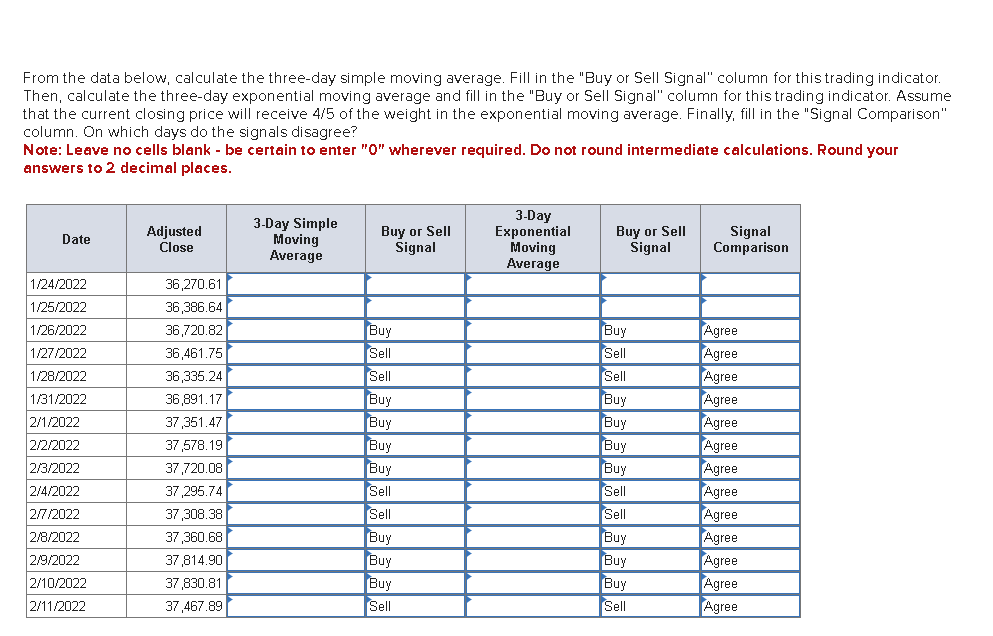
From the data below, calculate the three-day simple moving average. Fill in the "Buy or Sell Signal" column for this trading indicator. Then, calculate the three-day exponential moving average and fill in the "Buy or Sell Signal" column for this trading indicator. Assume that the current closing price will receive 4/5 of the weight in the exponential moving average. Finally, fill in the "Signal Comparison" column. On which days do the signals disagree? Note: Leave no cells blank - be certain to enter "0" wherever required. Do not round intermediate calculations. Round your answers to 2 decimal places. Date Adjusted Close 3-Day Simple Moving Average Buy or Sell Signal 3-Day Exponential Moving Buy or Sell Signal Signal Comparison Average 1/24/2022 36,270.61 1/25/2022 36,386.64 1/26/2022 36,720.82 Buy Buy Agree 1/27/2022 36,461.75 Sell Sell Agree 1/28/2022 36,335.24 Sell Sell Agree 1/31/2022 36,891.17 Buy Buy Agree 2/1/2022 37,351.47 Buy Buy Agree 2/2/2022 37,578.19 Buy Buy Agree 2/3/2022 37,720.08 Buy Buy Agree 2/4/2022 37,295.74 Sell Sell Agree 2/7/2022 37,308.38 Sell Sell Agree 2/8/2022 37,360.68 Buy Buy Agree 2/9/2022 37,814.90 Buy Buy Agree 2/10/2022 37,830.81 Buy Buy Agree 2/11/2022 37,467.89 Sell Sell Agree
Step by Step Solution
There are 3 Steps involved in it

Get step-by-step solutions from verified subject matter experts