

Question: From the data below for Apple (AAPL) stock, calculate the upper and lower Bollinger bands, which represent plus (or minus) two standard deviations of
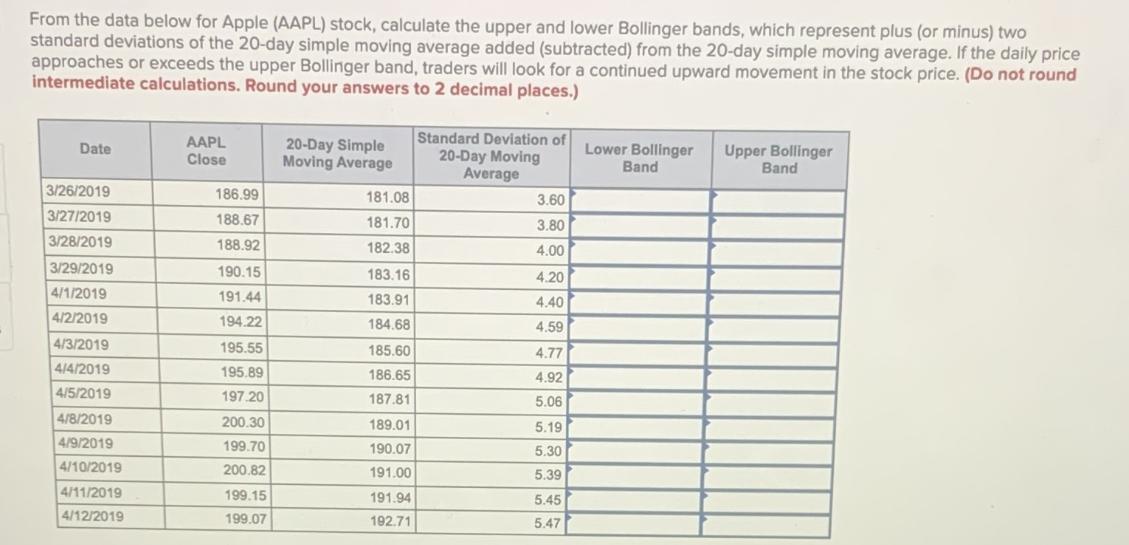
From the data below for Apple (AAPL) stock, calculate the upper and lower Bollinger bands, which represent plus (or minus) two standard deviations of the 20-day simple moving average added (subtracted) from the 20-day simple moving average. If the daily price approaches or exceeds the upper Bollinger band, traders will look for a continued upward movement in the stock price. (Do not round intermediate calculations. Round your answers to 2 decimal places.) Date 3/26/2019 3/27/2019 3/28/2019 3/29/2019 4/1/2019 4/2/2019 4/3/2019 4/4/2019 4/5/2019 4/8/2019 4/9/2019 4/10/2019 4/11/2019 4/12/2019 AAPL Close 186.99 188.67 188.92 190.15 191.44 194.22 195.55 195.89 197.20 200.30 199.70 200.82 199.15 199.07 20-Day Simple Moving Average 181.08 181.70 182.38 183.16 183.91 184.68 185.60 186.65 187.81 189.01 190.07 191.00 191.94 192.71 Standard Deviation of Lower Bollinger 20-Day Moving Average Band 3.60 3.80 4.00 4.20 4.40 4.59 4.77 4.92 5.06 5.19 5.30 5.39 5.45 5.47 Upper Bollinger Band
Step by Step Solution
3.28 Rating (157 Votes )
There are 3 Steps involved in it
To calculate the upper and lower Bollinger Bands we use the following formulas Lower Bollinger Band ... View full answer

Get step-by-step solutions from verified subject matter experts