

Question: From the data given below. (you can use calculator) (9 pts) Systolic 138 130 135 140 120 125 120 130 130 144 143 140
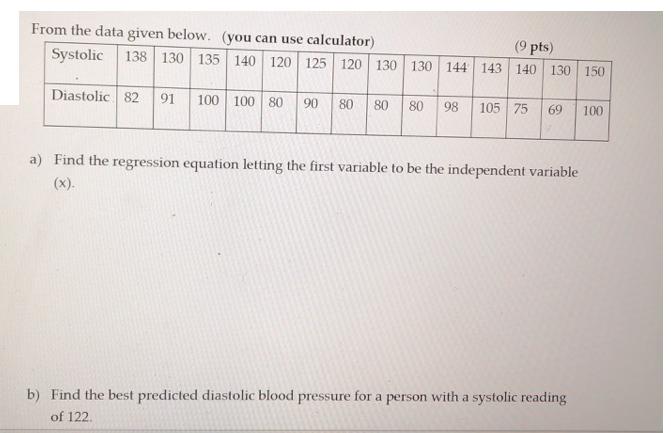

From the data given below. (you can use calculator) (9 pts) Systolic 138 130 135 140 120 125 120 130 130 144 143 140 130 150 Diastolic 82 91 100 100 80 90 80 80 80 98 105 75 69 100 a) Find the regression equation letting the first variable to be the independent variable (x). b) Find the best predicted diastolic blood pressure for a person with a systolic reading of 122. c) What percent of the variation in diastolic blood pressure can be explained by the linear relationship between systolic and diastolic?
Step by Step Solution
3.45 Rating (158 Votes )
There are 3 Steps involved in it
X 138 130 135 140 120 125 120 130 130 144 143 140 130 150 1875 Syy y n SxyExy y 82 91 100 100 80 ... View full answer

Get step-by-step solutions from verified subject matter experts