

Question: From the data using excel, we can find that, Profit 2015 Profit 2016 Two year change Two year averag in average numb e number
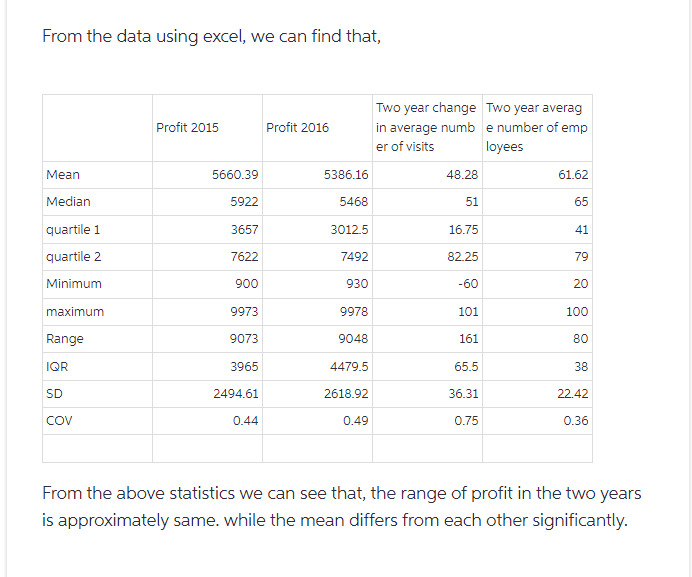
From the data using excel, we can find that, Profit 2015 Profit 2016 Two year change Two year averag in average numb e number of emp er of visits loyees Mean 5660.39 5386.16 48.28 61.62 Median 5922 5468 51 65 quartile 1 3657 3012.5 16.75 41 quartile 2 7622 7492 82.25 79 Minimum 900 930 -60 20 maximum 9973 9978 101 100 Range 9073 9048 161 80 IQR 3965 4479.5 65.5 38 SD 2494.61 2618.92 36.31 22.42 COV 0.44 0.49 0.75 0.36 From the above statistics we can see that, the range of profit in the two years is approximately same. while the mean differs from each other significantly.
Step by Step Solution
There are 3 Steps involved in it

Get step-by-step solutions from verified subject matter experts