

Question: From the discounted cash flow analysis, using a WACC 16.8 % as the discount rate. Find the implied equity value on January 1, 2021? Can
From the discounted cash flow analysis, using a WACC 16.8 % as the discount rate. Find the implied equity value on January 1, 2021? Can some one explain and help.
1) $79,946
2) $77,210
3) $73,712
4) $79,229
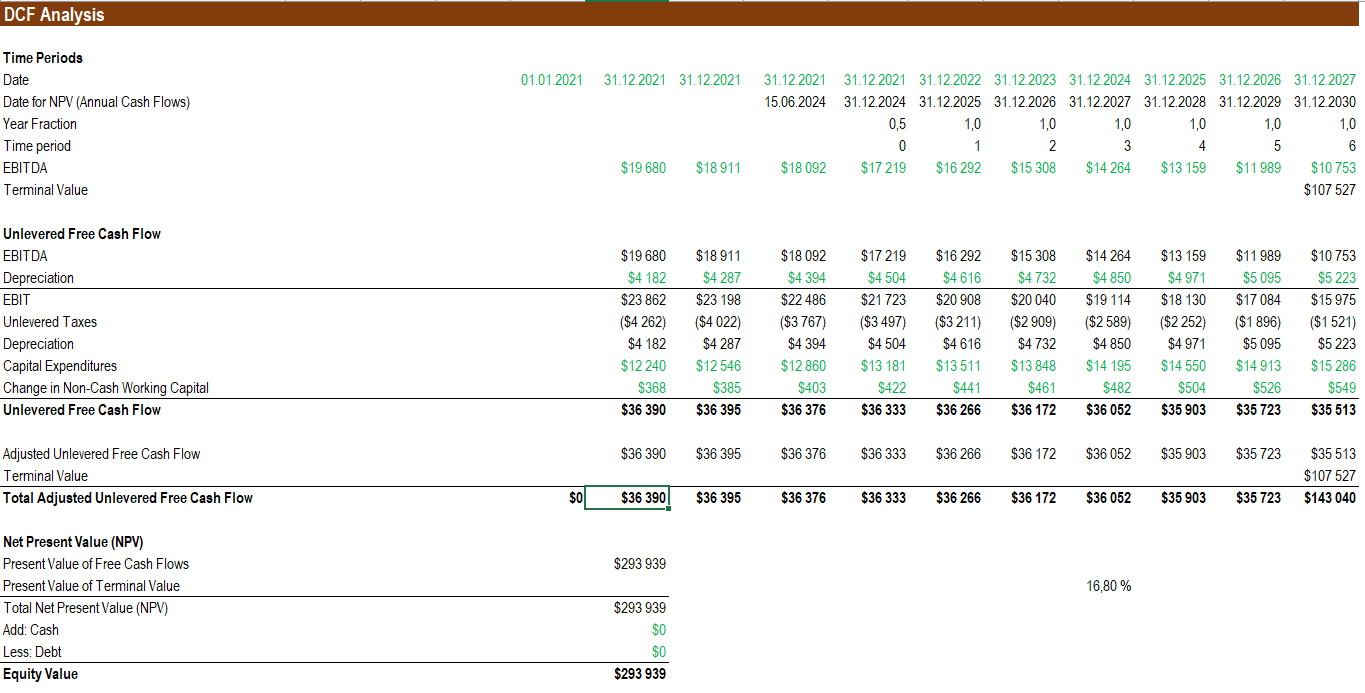
DCF Analysis 01.01.2021 31.12.2021 31.12.2021 Time Periods Date Date for NPV (Annual Cash Flows) Year Fraction Time period EBITDA Terminal Value 0,5 31.12.2021 31.12.2021 31.12.2022 31.12.2023 31.12.2024 31.12.2025 31.12.2026 31.12.2027 15.06.2024 31.12.2024 31.12.2025 31.12.2026 31.12.2027 31.12.2028 31.12.2029 31.12.2030 1,0 1,0 1.0 1,0 1,0 1,0 0 1 2 3 4 5 6 $18 092 $17219 $16 292 $15 308 $14264 $13 159 $11 989 $10 753 $107 527 $19 680 $18 911 Unlevered Free Cash Flow EBITDA Depreciation EBIT Unlevered Taxes Depreciation Capital Expenditures Change in Non-Cash Working Capital Unlevered Free Cash Flow $19 680 $4 182 $23 862 ($4 262) $4 182 $12 240 $368 $36 390 $18 911 $4287 $23 198 ($4022) $4 287 $12546 $385 $36 395 $18 092 $4 394 $22 486 ($3767) $4 394 $12 860 $403 $36 376 $17 219 $4504 $21723 ($3 497) $4504 $13 181 $422 $36 333 $16 292 $4616 $20 908 ($3 211) $4616 $13511 $441 $36 266 $15 308 $4732 $20 040 ($2 909) $4 732 $13 848 $461 $36 172 $14 264 $4850 $19 114 ($2 589) $4 850 $14 195 $482 $36 052 $13 159 $4 971 $18 130 ($2 252) $4971 $14550 $504 $35 903 $11 989 $5095 $17084 ($1 896) $5 095 $14913 $526 $35 723 $10753 $5 223 $15 975 ($1 521) $5 223 $15 286 $549 $35 513 $36 390 $36 395 $36 376 $36 333 $36 266 $36 172 $36 052 $35 903 $35 723 Adjusted Unlevered Free Cash Flow Terminal Value Total Adjusted Unlevered Free Cash Flow $35 513 $107 527 $143 040 $0) $36 390 $36 395 $36 376 $36 333 $36 266 $36 172 $36 052 $35 903 $35 723 $293 939 16,80 % Net Present Value (NPV) Present Value of Free Cash Flows Present Value of Terminal Value Total Net Present Value (NPV) Add: Cash Less: Debt Equity Value $293 939 $0 $0 $293 939 DCF Analysis 01.01.2021 31.12.2021 31.12.2021 Time Periods Date Date for NPV (Annual Cash Flows) Year Fraction Time period EBITDA Terminal Value 0,5 31.12.2021 31.12.2021 31.12.2022 31.12.2023 31.12.2024 31.12.2025 31.12.2026 31.12.2027 15.06.2024 31.12.2024 31.12.2025 31.12.2026 31.12.2027 31.12.2028 31.12.2029 31.12.2030 1,0 1,0 1.0 1,0 1,0 1,0 0 1 2 3 4 5 6 $18 092 $17219 $16 292 $15 308 $14264 $13 159 $11 989 $10 753 $107 527 $19 680 $18 911 Unlevered Free Cash Flow EBITDA Depreciation EBIT Unlevered Taxes Depreciation Capital Expenditures Change in Non-Cash Working Capital Unlevered Free Cash Flow $19 680 $4 182 $23 862 ($4 262) $4 182 $12 240 $368 $36 390 $18 911 $4287 $23 198 ($4022) $4 287 $12546 $385 $36 395 $18 092 $4 394 $22 486 ($3767) $4 394 $12 860 $403 $36 376 $17 219 $4504 $21723 ($3 497) $4504 $13 181 $422 $36 333 $16 292 $4616 $20 908 ($3 211) $4616 $13511 $441 $36 266 $15 308 $4732 $20 040 ($2 909) $4 732 $13 848 $461 $36 172 $14 264 $4850 $19 114 ($2 589) $4 850 $14 195 $482 $36 052 $13 159 $4 971 $18 130 ($2 252) $4971 $14550 $504 $35 903 $11 989 $5095 $17084 ($1 896) $5 095 $14913 $526 $35 723 $10753 $5 223 $15 975 ($1 521) $5 223 $15 286 $549 $35 513 $36 390 $36 395 $36 376 $36 333 $36 266 $36 172 $36 052 $35 903 $35 723 Adjusted Unlevered Free Cash Flow Terminal Value Total Adjusted Unlevered Free Cash Flow $35 513 $107 527 $143 040 $0) $36 390 $36 395 $36 376 $36 333 $36 266 $36 172 $36 052 $35 903 $35 723 $293 939 16,80 % Net Present Value (NPV) Present Value of Free Cash Flows Present Value of Terminal Value Total Net Present Value (NPV) Add: Cash Less: Debt Equity Value $293 939 $0 $0 $293 939
Step by Step Solution
There are 3 Steps involved in it

Get step-by-step solutions from verified subject matter experts