

Question: From the example on the image I would like to know a - what is the characteristics line of XYZ b - Does ABR or
From the example on the image I would like to know a - what is the characteristics line of XYZ b - Does ABR or XYZ have a greater systematic risk ? c - What proportion of the XYZ is firm specific risk?
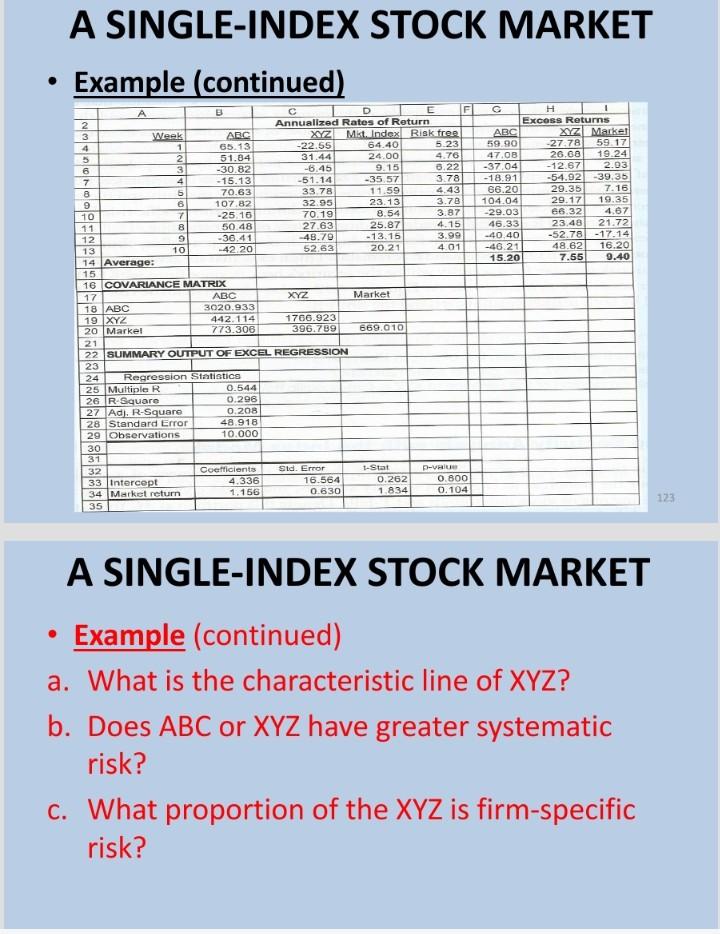
a. What is the characteristic line of \( X Y Z \) ? b. Does \( A B C \) or \( X Y Z \) have greater systematic risk? c. What proportion of the \( X Y Z \) is firm-specific risk?
a. What is the characteristic line of \( X Y Z \) ? b. Does \( A B C \) or \( X Y Z \) have greater systematic risk? c. What proportion of the \( X Y Z \) is firm-specific risk?
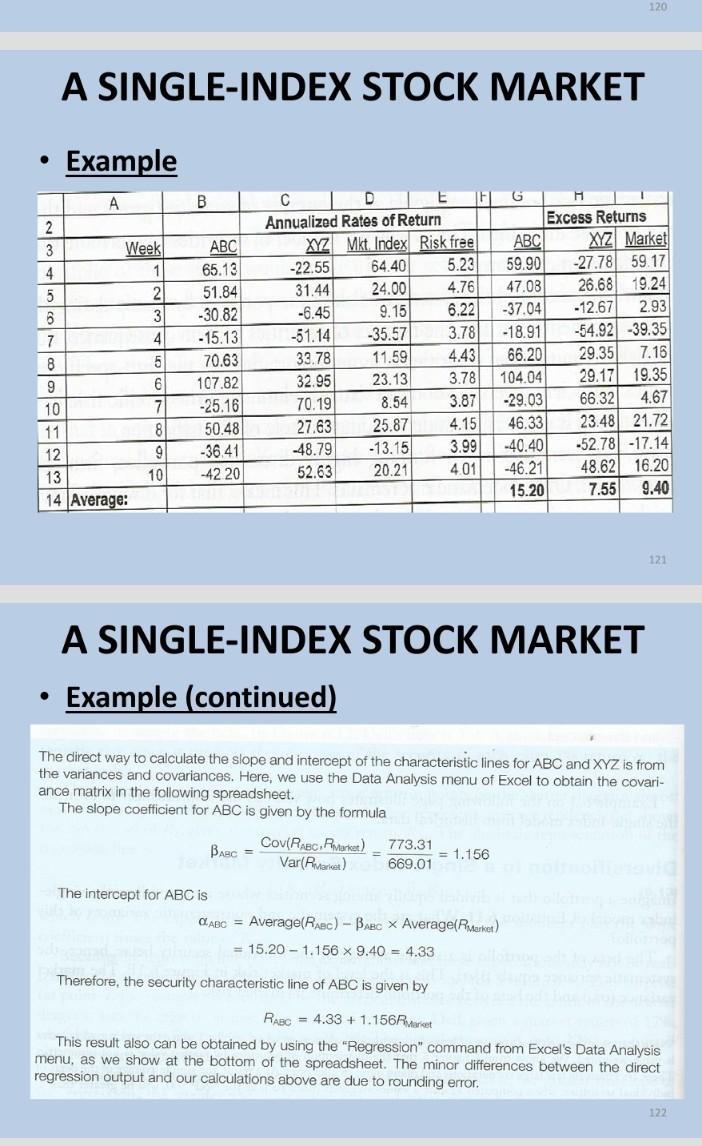
A SINGLE-INDEX STOCK MARKET - Example A SINGLE-INDEX STOCK MARKET - Example (continued) The direct way to calculate the slope and intercept of the characteristic lines for ABC and XYZ is from the variances and covariances. Here, we use the Data Analysis menu of Excel to obtain the covari. ance matrix in the following spreadsheet. The slope coefficient for ABC is given by the formula ABC=Var(RMatitec)Cov(RABC,RMatraC)=669.01773.31=1.156 The intercept for ABC is ABC=Average(RABC)ABCAverage(RMextec)=15.201.1569.40=4.33 Therefore, the security characteristic line of ABC is given by RABC=4.33+1.156Rmaret This result also can be obtained by using the "Regression" command from Excel's Data Analysis menu, as we show at the bottom of the spreadsheet. The minor differences between the direct regression output and our calculations above are due to rounding error. ding error A SINGLE-INDEX STOCK MARKET - Example (continued) A SINGLE-INDEX STOCK MARKET - Example (continued) a. What is the characteristic line of XYZ ? b. Does ABC or XYZ have greater systematic risk? c. What proportion of the XYZ is firm-specific risk? A SINGLE-INDEX STOCK MARKET - Example A SINGLE-INDEX STOCK MARKET - Example (continued) The direct way to calculate the slope and intercept of the characteristic lines for ABC and XYZ is from the variances and covariances. Here, we use the Data Analysis menu of Excel to obtain the covari. ance matrix in the following spreadsheet. The slope coefficient for ABC is given by the formula ABC=Var(RMatitec)Cov(RABC,RMatraC)=669.01773.31=1.156 The intercept for ABC is ABC=Average(RABC)ABCAverage(RMextec)=15.201.1569.40=4.33 Therefore, the security characteristic line of ABC is given by RABC=4.33+1.156Rmaret This result also can be obtained by using the "Regression" command from Excel's Data Analysis menu, as we show at the bottom of the spreadsheet. The minor differences between the direct regression output and our calculations above are due to rounding error. ding error A SINGLE-INDEX STOCK MARKET - Example (continued) A SINGLE-INDEX STOCK MARKET - Example (continued) a. What is the characteristic line of XYZ ? b. Does ABC or XYZ have greater systematic risk? c. What proportion of the XYZ is firm-specific risk
Step by Step Solution
There are 3 Steps involved in it

Get step-by-step solutions from verified subject matter experts