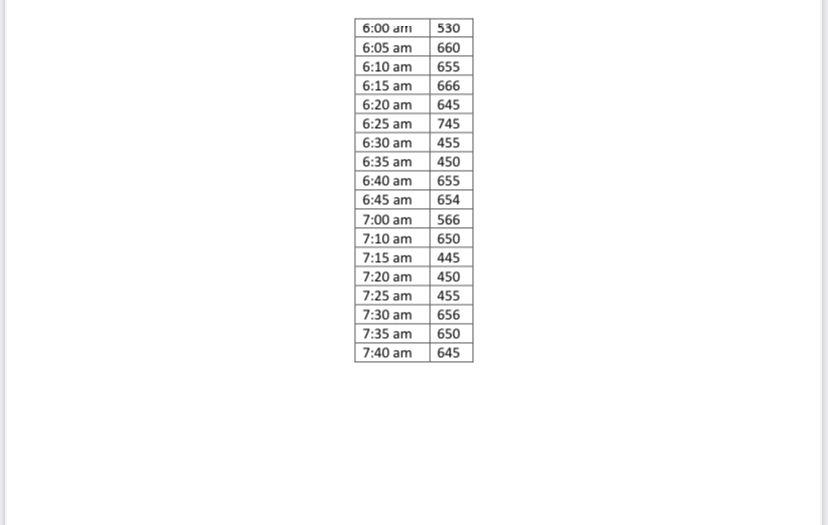
Question: From the following data, construct a Run Chart and conclude based on your results begin{tabular}{|l|l|} hline 6:00din & 530 hline 6:05am & 660

From the following data, construct a Run Chart and conclude based on your results

From the following data, construct a Run Chart

\begin{tabular}{|l|l|} \hline 6:00din & 530 \\ \hline 6:05am & 660 \\ \hline 6:10am & 655 \\ \hline 6:15am & 666 \\ \hline 6:20am & 645 \\ \hline 6:25am & 745 \\ \hline 6:30am & 455 \\ \hline 6:35am & 450 \\ \hline 6:40am & 655 \\ \hline 6:45am & 654 \\ \hline 7:00am & 566 \\ \hline 7:10am & 650 \\ \hline 7:15am & 445 \\ \hline 7:20am & 450 \\ \hline 7:25am & 455 \\ \hline 7:30am & 656 \\ \hline 7:35am & 650 \\ \hline 7:40am & 645 \\ \hline \end{tabular}

Step by Step Solution

There are 3 Steps involved in it

1 Expert Approved Answer
Step: 1 Unlock blur-text-image
Question Has Been Solved by an Expert!

Get step-by-step solutions from verified subject matter experts

Step: 2 Unlock
Step: 3 Unlock

Students Have Also Explored These Related General Management Questions!