

Question: From the graph, estimate the bias (in ADUs per pixel) and the dark current (in ADUs per second per pixel). 7. Sample Mean Signal (Per
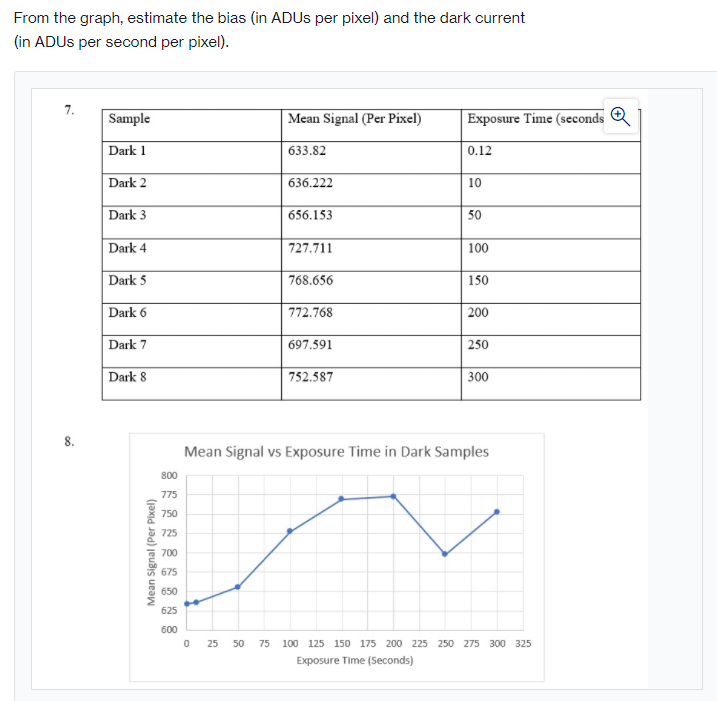
From the graph, estimate the bias (in ADUs per pixel) and the dark current (in ADUs per second per pixel). 7. Sample Mean Signal (Per Pixel) Exposure Time (seconds Dark 1 633.82 0.12 Dark 2 636.222 10 Dark 3 656.153 50 Dark 4 727.711 100 Dark 5 768.656 150 Dark 6 772.768 200 Dark 7 697.591 250 Dark 8 752.587 300 8. Mean Signal vs Exposure Time in Dark Samples 800 775 750 725 300 Mean Signal (Per Pixel) 675 650 625 600 0 25 50 75 100 125 150 175 200 225 250 275 300 325 Exposure Time (Seconds)
Step by Step Solution
There are 3 Steps involved in it
1 Expert Approved Answer
Step: 1 Unlock

Question Has Been Solved by an Expert!
Get step-by-step solutions from verified subject matter experts
Step: 2 Unlock
Step: 3 Unlock