

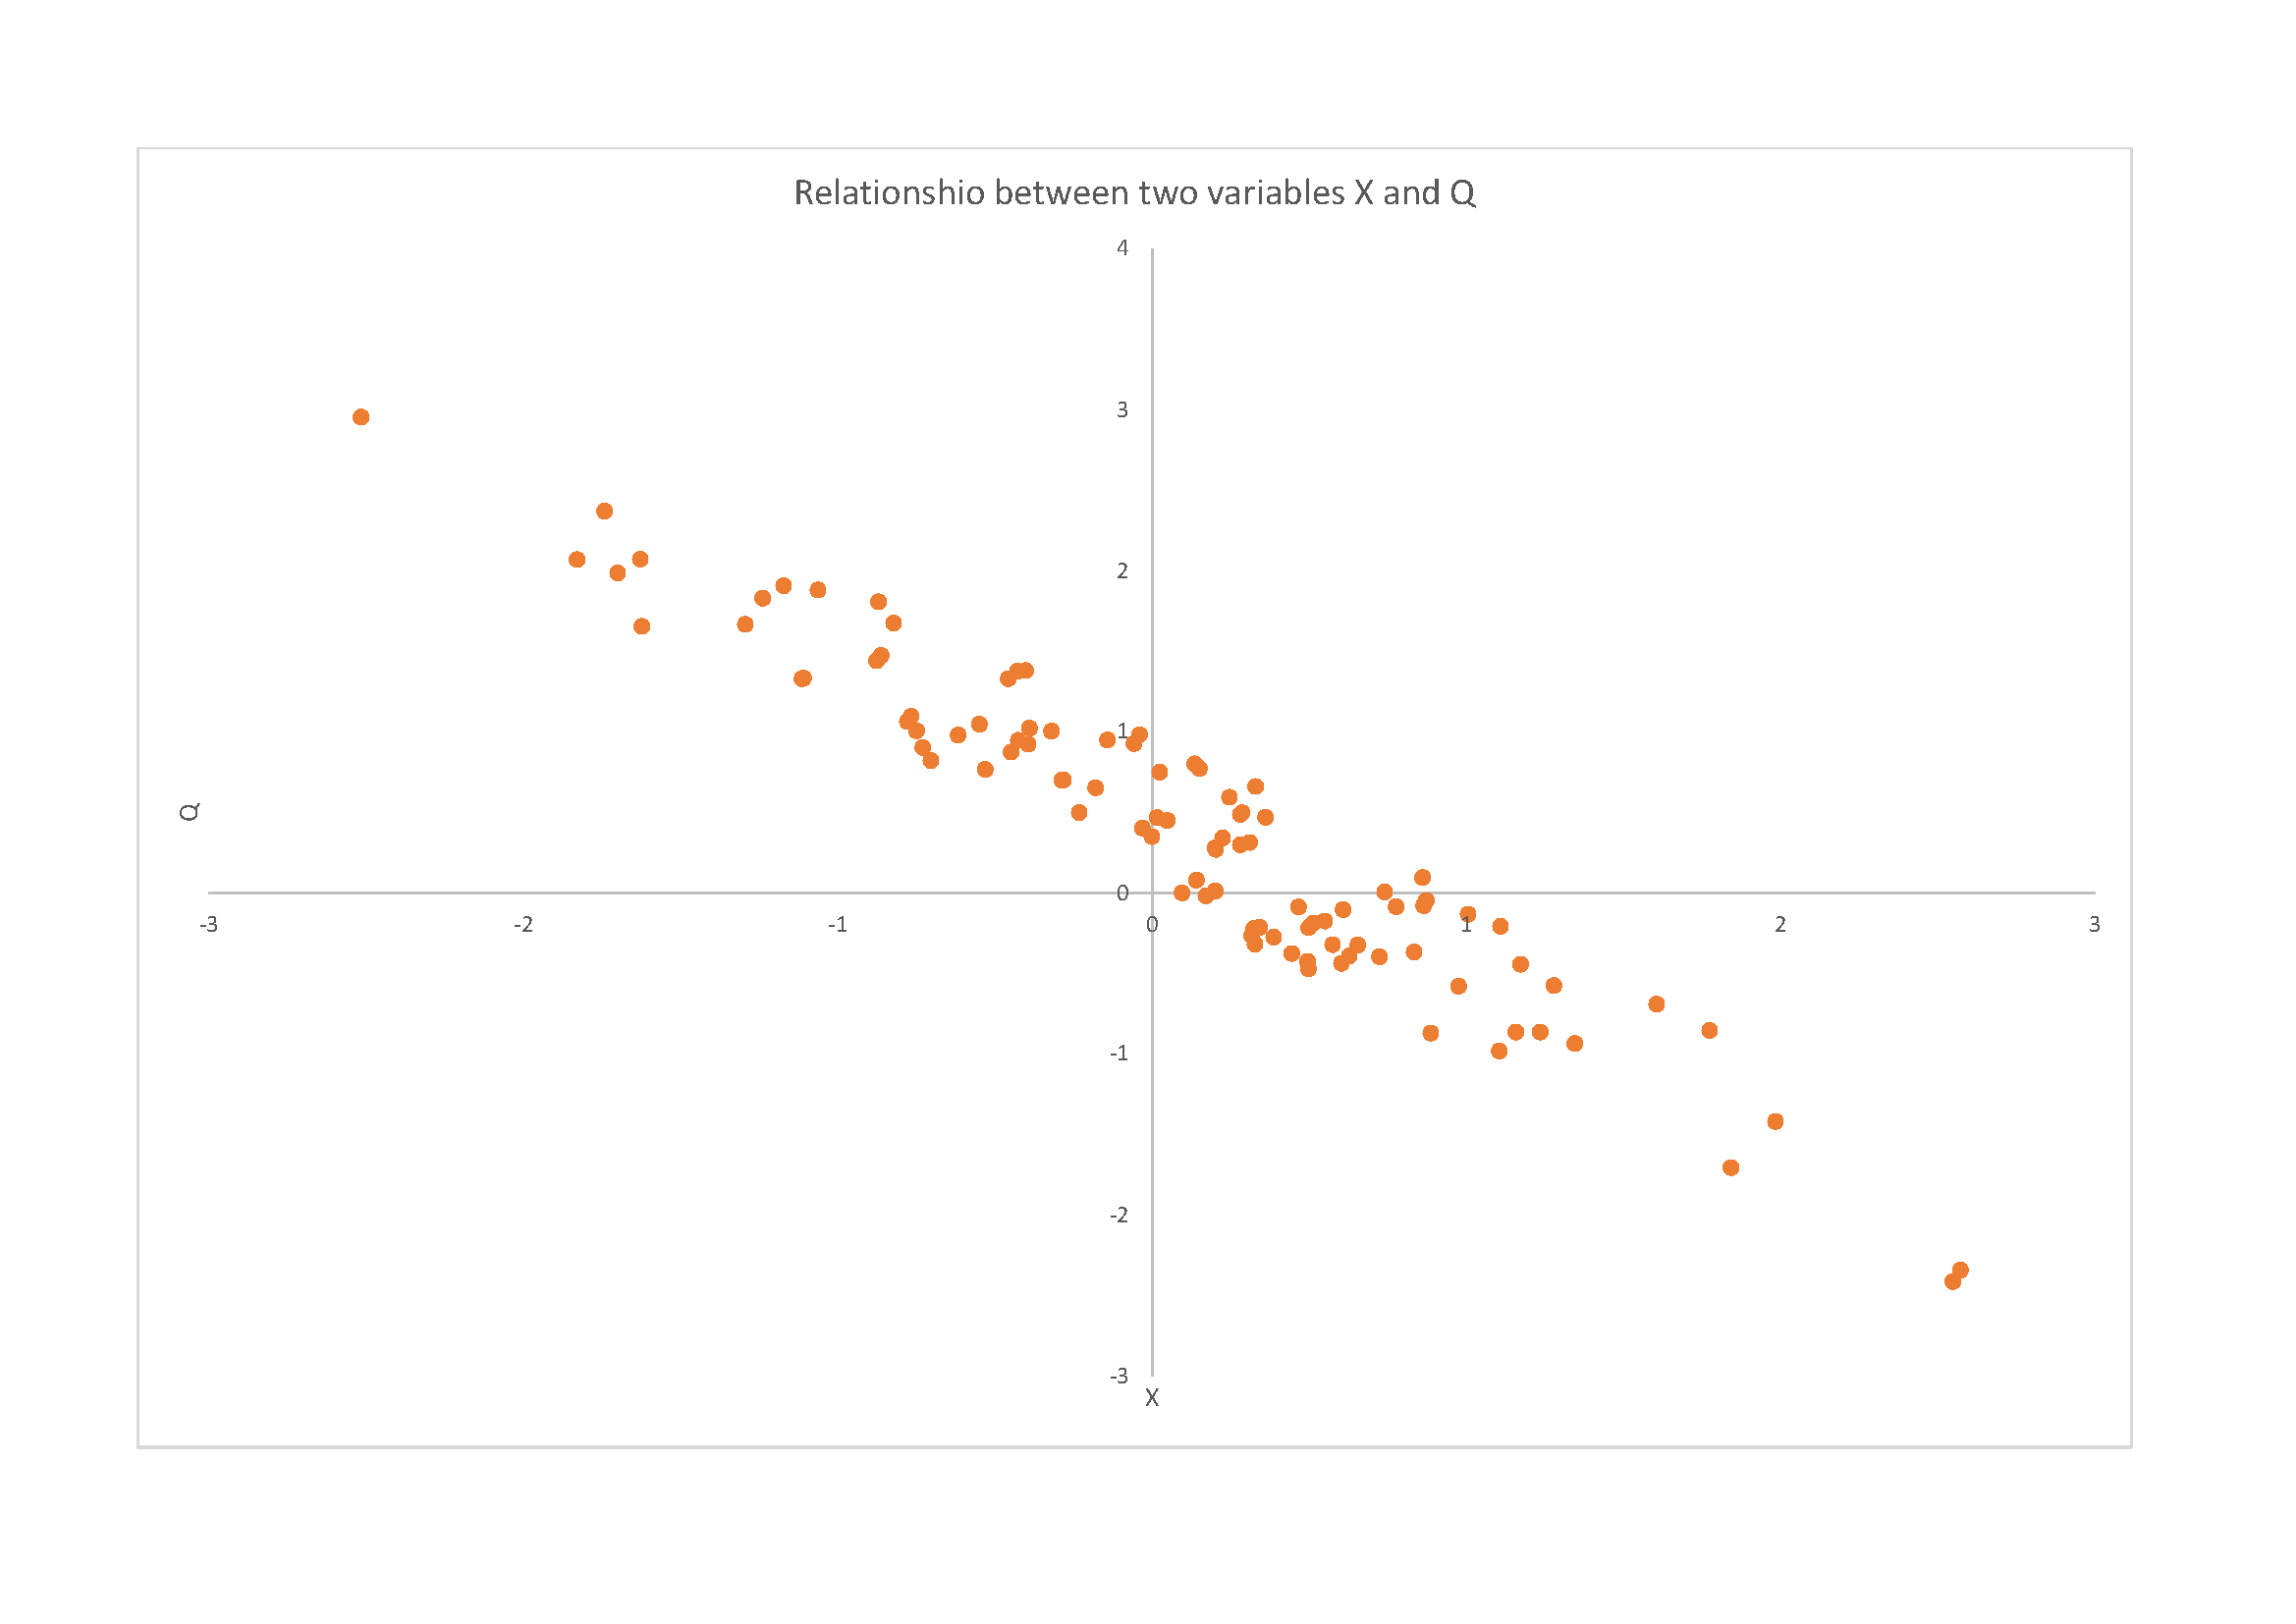
Question: From the graph, we can see that the correlation coefficient of X and Q is likely to be Group of answer choices: a negative number
From the graph, we can see that the correlation coefficient of X and Q is likely to be
Group of answer choices:
- a negative number larger than but very close to -1.0
- a positive number smaller than but close to 1.0
- a positive number larger than but close to +1.0
- a negative number smaller than but close to -1.0
\f
Step by Step Solution
There are 3 Steps involved in it
1 Expert Approved Answer
Step: 1 Unlock

Question Has Been Solved by an Expert!
Get step-by-step solutions from verified subject matter experts
Step: 2 Unlock
Step: 3 Unlock