

Question: From the Mayberry Ltd. Financial Statement provided, calculate THREE (3) investor ratios for the years 2019 and 2020: DED MAYBERRY INVESTMENTS LIMITED CONSOLIDATED STATEMENT OF
From the Mayberry Ltd. Financial Statement provided, calculate THREE (3) investor ratios for the years 2019 and 2020:
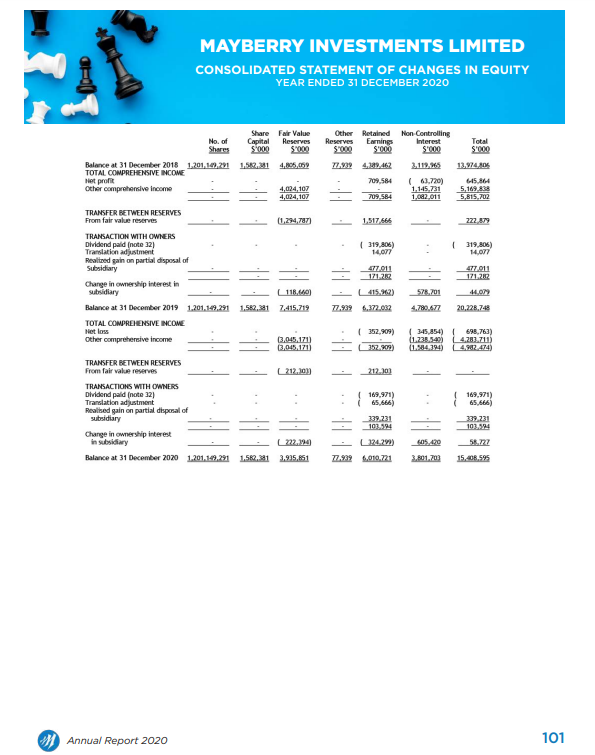
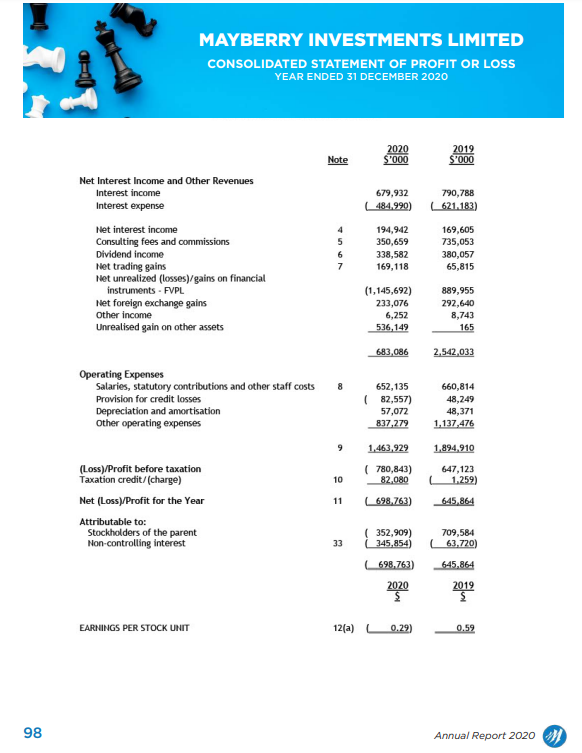
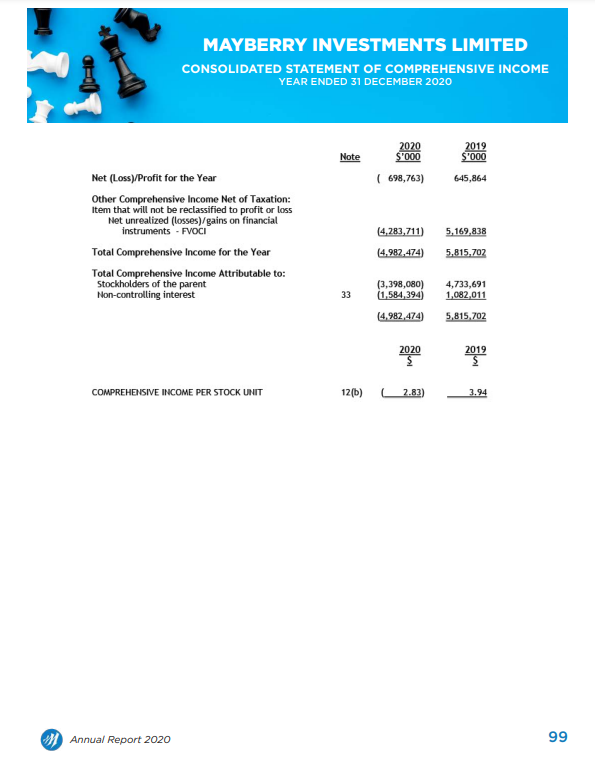
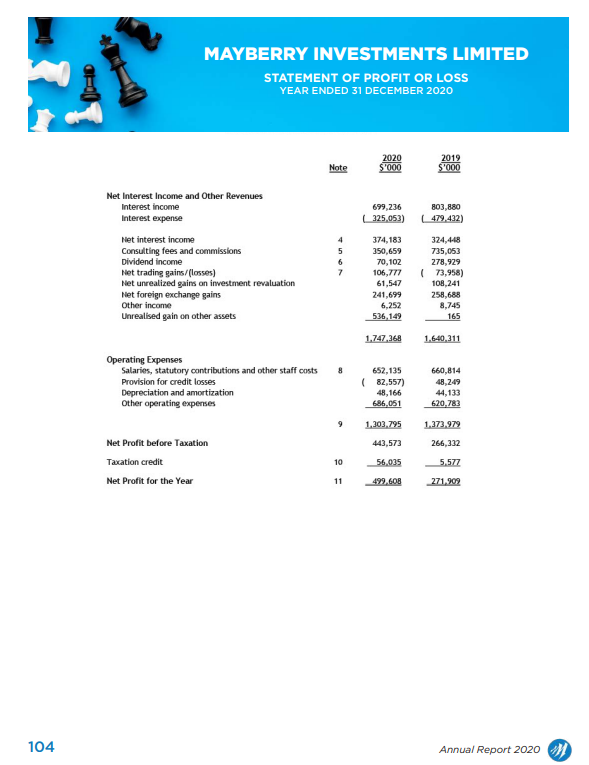
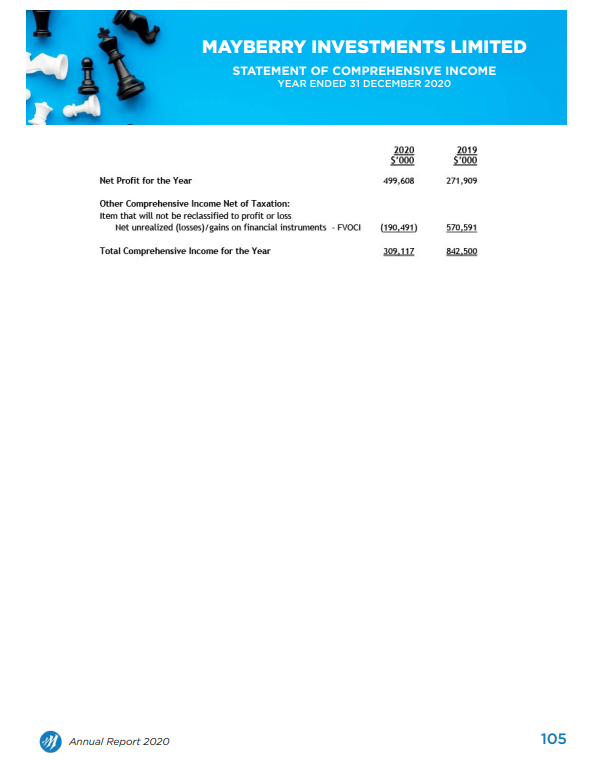
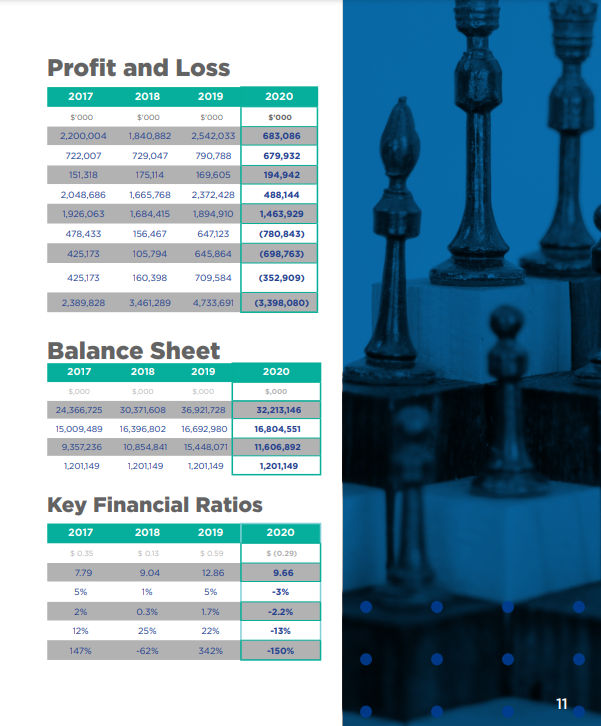
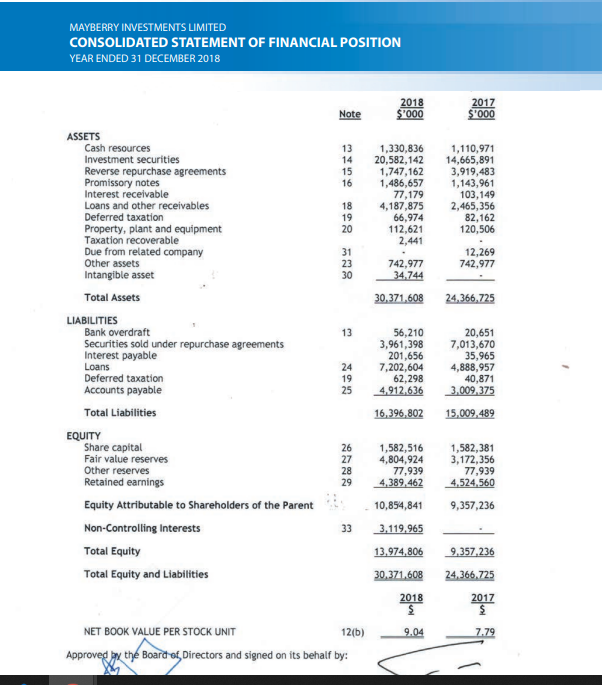
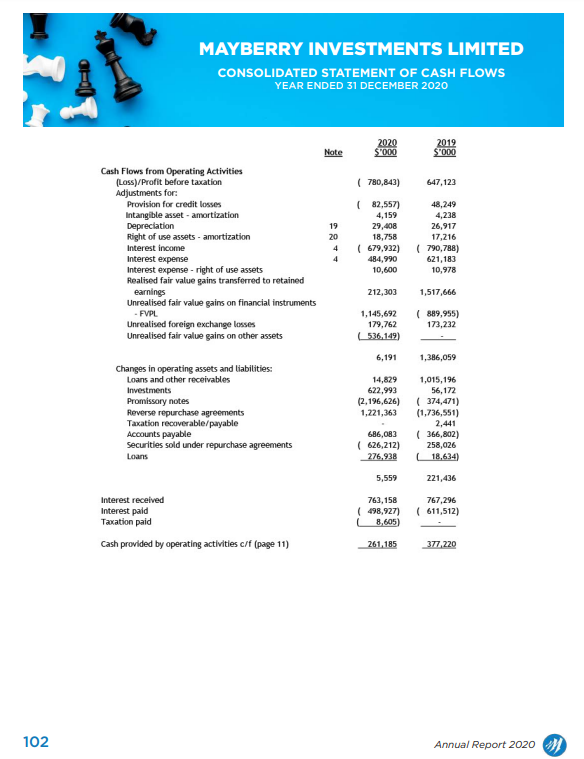
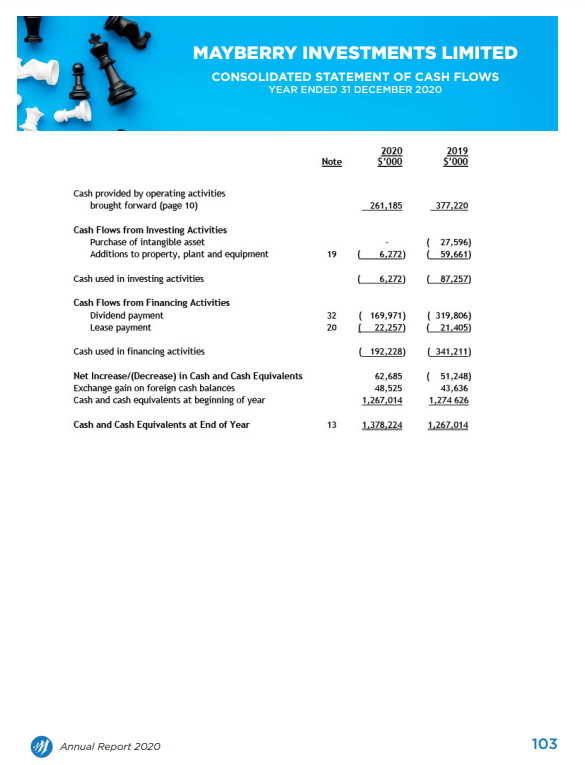
DED MAYBERRY INVESTMENTS LIMITED CONSOLIDATED STATEMENT OF CHANGES IN EQUITY YEAR ENDED 31 DECEMBER 2020 Total Other Retained Non Controlling Reserves Earnings Interest SO S1000 $ 0.00 77.739 4.149,462 3.119.5 709,584 ( 63.720) 1.145.231 703564 1.002.011 SOOO 13.974.04 645.864 5,109.828 5,815,702 1.517.466 222 879 (319,406) 14.077 319,806) 14,077 4770 17122 477011 121 222 Share Fair Value No. of Capital) Reserves 5000 5700 Balance at 31 December 2018 1,201,10,221 1.512.1 4,805.09 TOTAL COMPREHENSIVE INCOME Het profit Other comprehensive Income 4,024,107 4,024, 107 TRANSFER BETWEEN RESERVES From fair value reserves (1,294,787) TRANSACTION WITH OWNERS Dividend pald (note 32) Translation adjustment Realted gain on partial disposal of Subsidiary Change in ownership interest in subsidiary 118.60) Balance at 31 December 2019 1.201.149.291 1.562.381 7,415,719 TOTAL COMPREHENSIVE INCOME Net loss Other comprehensive Income 13.045.171) (3.045.171) TRANSFER BETWEEN RESERVES From fair values reserves 212.10) TRANSACTIONS WITH OWNERS Dividend paldinote 32) Translation adjustment Realised gain on partial disposal of subsidiary Change in ownership interest in subsidiary 222.224 Balance at 31 December 2020 1,201,149,291 1.562.21 3.925,651 415.2) 528,201 HON 77.939 6.372.032 4.780.677 20.228.748 (352,909) (345,854) 698,763) 1.238.549 4.283.711) 11.584.394) L402 474) 357.909) 212.30 169,971) 65.666) 169,971) 65,666) 379,231 339,231 103,594 12420) 103.524 405.429 3.801.2012 77.939 0.010.221 15.408.595 Annual Report 2020 101 MAYBERRY INVESTMENTS LIMITED CONSOLIDATED STATEMENT OF PROFIT OR LOSS YEAR ENDED 31 DECEMBER 2020 Note 2020 S'000 2019 S'000 679,932 | 484.990) 790,788 621.183) Net Interest Income and Other Revenues Interest income Interest expense Net interest income Consulting fees and commissions Dividend income Net trading gains Net unrealized (losses)/gains on financial instruments - FVPL Net foreign exchange gains Other income Unrealised gain on other assets 5 6 7 194,942 350,659 338,582 169,118 169,605 735,053 380,057 65,815 (1,145,692) 233,076 6,252 536,149 889,955 292,640 8,743 165 683,086 2.542,033 8 Operating Expenses Salaries, statutory contributions and other staff costs Provision for credit losses Depreciation and amortisation Other operating expenses 652,135 (82,557) 57,072 837,279 660,814 48,249 48,371 1,137,476 9 1,463,929 1.894.910 10 (780,843) 82.080 647,123 1,259) 11 (Loss)/Profit before taxation Taxation credit/(charge) Net (Loss)/Profit for the Year Attributable to: Stockholders of the parent Non-controlling interest 698.763) 645,864 33 709,584 63,720) (352,909) 345,854) 698.763) 2020 645.864 2019 $ EARNINGS PER STOCK UNIT 12(a) 0.29) 0.59 98 Annual Report 2020 DED MAYBERRY INVESTMENTS LIMITED CONSOLIDATED STATEMENT OF COMPREHENSIVE INCOME YEAR ENDED 31 DECEMBER 2020 2019 S'000 Note 2020 $'000 ( 698,763) 645,864 (4,283,711) 5,169,838 Net (Loss)/Profit for the Year Other Comprehensive Income Net of Taxation: Item that will not be reclassified to profit or loss Net unrealized (losses)/gains on financial instruments - FVOCI Total Comprehensive Income for the Year Total Comprehensive Income Attributable to: Stockholders of the parent Non-controlling interest 14.987,474) 5,815,702 33 (3,398,080) (1,584,394) 4,733,691 1,082,011 (4.982,474) 5,815,702 2020 $ 2019 S COMPREHENSIVE INCOME PER STOCK UNIT 12(b) 2.83) 3.94 Annual Report 2020 99 MAYBERRY INVESTMENTS LIMITED STATEMENT OF PROFIT OR LOSS YEAR ENDED 31 DECEMBER 2020 2020 $1000 Note 2019 $'000 Net Interest Income and Other Revenues Interest income Interest expense 699,236 325,053) 803,880 (479,432) 4 5 6 7 Net interest income Consulting fees and commissions Dividend income Net trading gains/(losses) Net unrealized gains on investment revaluation Net foreign exchange gains Other income Unrealised gain on other assets 374,183 350,659 70, 102 106,777 61,547 241,699 324,4-18 735,053 278,929 73,958) 108,241 258,688 8,745 165 6,252 536,149 1.747,368 1.640,311 8 Operating Expenses Salaries, statutory contributions and other staff costs Provision for credit losses Depreciation and amortization Other operating expenses 652,135 (82,557) 48,166 686.051 660,814 48,249 44,133 620.783 9 1,303,795 1,373,979 443,573 266,332 Net Profit before Taxation Taxation credit Net Profit for the Year 10 56,035 5,577 11 499,608 271.909 104 Annual Report 2020 00HD MAYBERRY INVESTMENTS LIMITED STATEMENT OF COMPREHENSIVE INCOME YEAR ENDED 31 DECEMBER 2020 2020 $'000 2019 $1000 499,608 271,909 Net Profit for the Year Other Comprehensive Income Net of Taxation: Item that will not be reclassified to profit or loss Net unrealized (losses) /gains on financial instruments - FOCI Total Comprehensive Income for the Year (190,491) 570,591 309,117 842.500 Annual Report 2020 105 2020 Profit and Loss 2017 2018 2019 $000 $'000 s'000 2.200,004 1,840,882 2,542,033 722,007 729,047 790,788 151,318 175,114 169.605 2,048,686 1,665,768 2,372,428 1.926.063 1,684,415 1,894,910 s'ooo 683,086 679,932 194,942 488,144 156,467 647,123 478,433 425,173 1,463,929 (780,843) (698,763) 105,794 645,864 709,584 (352,909) 425,173 2,389,828 160,398 3,461,289 4,733.691 (3,398,080) Balance Sheet 2017 2018 2019 5.000 5,000 5.000 2020 5.000 24,366,725 30,371,608 36,921,728 15,009,489 16,396.802 16,692,980 32,213,146 16,804,551 11,606,892 9,357,236 10,854,841 15,448,071 1201,149 1,201,149 1,201,149 1,201,149 Key Financial Ratios 2017 2018 2019 2020 $0.35 $ 0.13 $ 0.59 $(0.29) 7.79 9.04 12.86 9.66 1% 5% -3% 5% 2% 0.3% 1.7% -2.2% 12% 25% 22% -13% 147% -626 342% -150% 11 MAYBERRY INVESTMENTS LIMITED CONSOLIDATED STATEMENT OF FINANCIAL POSITION YEAR ENDED 31 DECEMBER 2018 2018 $'000 2017 $'000 Note 13 14 15 16 1,330,836 20,582,142 1,747,162 1,486,657 77,179 4,187,875 66,974 112,621 2,441 1,110,971 14,665,891 3,919,483 1,143,961 103,149 2,465,356 82,162 120,506 18 19 20 31 23 30 742,977 34.744 12,269 742,977 30,371,608 24,366,725 13 ASSETS Cash resources Investment securities Reverse repurchase agreements Promissory notes Interest receivable Loans and other receivables Deferred taxation Property, plant and equipment Taxation recoverable Due from related company Other assets Intangible asset Total Assets LIABILITIES Bank overdraft Securities sold under repurchase agreements Interest payable Loans Deferred taxation Accounts payable Total Liabilities EQUITY Share capital Fair value reserves Other reserves Retained earnings Equity Attributable to Shareholders of the Parent Non-Controlling Interests Total Equity Total Equity and Liabilities 24 19 25 56,210 3,961,398 201,656 7,202,604 62,298 4.912,636 20,651 7,013,670 35,965 4,888,957 40,871 3.009.375 16,396, 802 15,009,489 26 27 28 29 1,582,516 4,804,924 77,939 4,389,462 1,582,381 3,172,356 77,939 4,524,560 10,854,841 9,357,236 33 3.119.965 13.974,806 30,371,608 9.357.236 24,366,725 2018 $ 2017 $ 9.04 7.79 NET BOOK VALUE PER STOCK UNIT 12(6) Approved to the Board of Directors and signed on its behalf by: -D MAYBERRY INVESTMENTS LIMITED CONSOLIDATED STATEMENT OF CASH FLOWS YEAR ENDED 31 DECEMBER 2020 Note 2020 $"000 2019 $ 000 (780,843) 647,123 Cash Flows from Operating Activities (Loss)/Profit before taxation Adjustments for: Provision for credit losses Intangible asset - amortization Depreciation Right of use assets - amortization Interest income Interest expense Interest expense-right of use assets Realised fair value gains transferred to retained earnings Unrealised fair value gains on financial instruments - FVPL Unrealised foreign exchange losses Unrealised fair value gains on other assets 19 20 4 4 (82,557) 4,159 29,408 18,758 (679,932) 484,990 10,600 48,249 4,238 26,917 17,216 (790,788) 621,183 10,978 212,303 1,517,666 1,145,692 179,762 536.149) (889,955) 173,232 6,191 1,386,059 Changes in operating assets and liabilities: Loans and other receivables Investments Promissory notes Reverse repurchase agreements Taxation recoverable/payable Accounts payable Securities sold under repurchase agreements Loans 14,829 622,993 (2.196,626) 1,221,363 1,015,196 56,172 ( 374,471) (1,736,551) 2,441 ( 366,802) 258,026 18,634) 686,083 (626,212) 276,938 5,559 221,436 Interest received Interest paid Taxation paid 763,158 (498,927) 8,605) 767,296 (611,512) Cash provided by operating activities c/f (page 11) 261,185 377.220 102 Annual Report 2020 MAYBERRY INVESTMENTS LIMITED CONSOLIDATED STATEMENT OF CASH FLOWS YEAR ENDED 31 DECEMBER 2020 2020 S'000 Note 2012 $'000 261.185 377.220 19 L (27,596) 59,661) 6,272) 6,272) 87,257) Cash provided by operating activities brought forward (page 10) Cash Flows from Investing Activities Purchase of intangible asset Additions to property, plant and equipment Cash used in investing activities Cash Flows from Financing Activities Dividend payment Lease payment Cash used in financing activities Net Increase/(Decrease) in Cash and Cash Equivalents Exchange gain on foreign cash balances Cash and cash equivalents at beginning of year Cash and Cash Equivalents at End of Year 32 20 (169,971) 22,257) ( 319,806) 21,405) 192,228) ( 341,211) 62,685 48,525 1,267,014 (51,248) 43,636 1,274 626 13 1,378,224 1,267,014 Annual Report 2020 103
Step by Step Solution
There are 3 Steps involved in it

Get step-by-step solutions from verified subject matter experts