

Question: From the production function given in the following table, draw a figure showing (a) the isoquants for 8, 12, and 16 units of output
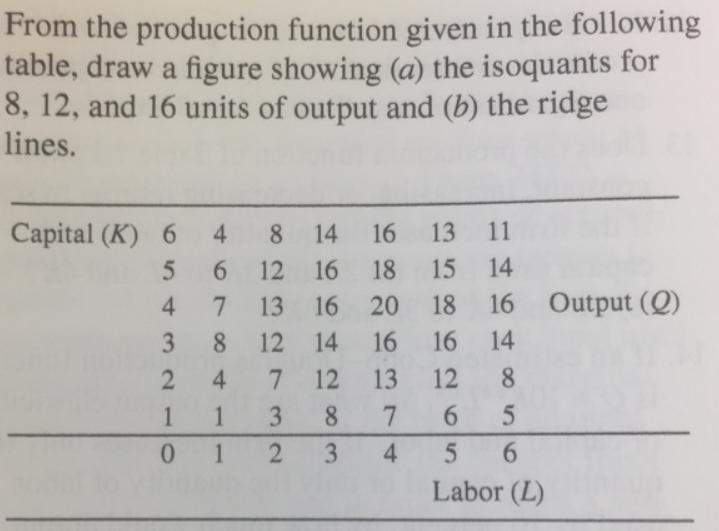
From the production function given in the following table, draw a figure showing (a) the isoquants for 8, 12, and 16 units of output and (b) the ridge lines. Capital (K) 6 4 8 14 6 12 16 16 13 11 18 15 14 4 13 16 20 18 16 Output (Q) 3 8 12 14 16 16 14 4. 7 12 13 12 8. 1 3 8. 6. 0 1 2 3 6. Labor (L) 4. 1 1
Step by Step Solution
★★★★★
3.49 Rating (159 Votes )
There are 3 Steps involved in it
1 Expert Approved Answer
Step: 1 Unlock

A B E 2 For Outpur Q 8 Ridge lines 3 4 5 7 6 Capital ... View full answer
Question Has Been Solved by an Expert!
Get step-by-step solutions from verified subject matter experts
Step: 2 Unlock
Step: 3 Unlock