

Question: From the SPSS output below, what can we conclude from the data? (Reject/accept the null). Also, what would be the p-value? Group Statistics Age group
From the SPSS output below, what can we conclude from the data? (Reject/accept the null). Also, what would be the p-value?
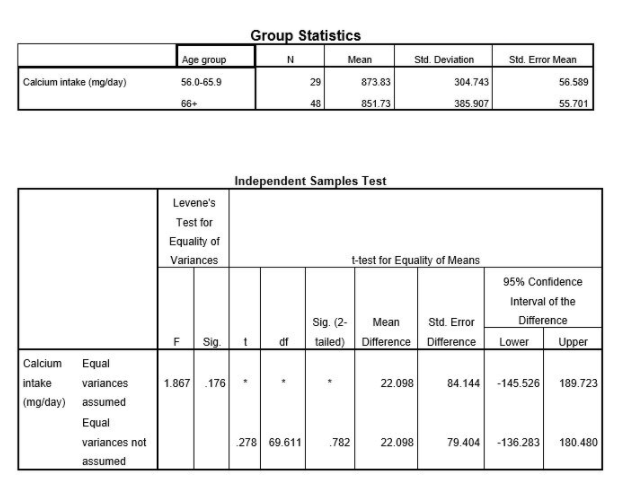
Group Statistics Age group N Mean Sid. Deviation Std. Error Mear Calcium intake (mo/day) 56.0-65.9 29 873.83 304.743 56.589 66+ 48 851.73 385.907 55.701 Independent Samples Test Levene's Test for Equality of Variances t-test for Equality of Means 95% Confidence Interval of the Sig. (2- Mean Std. Error Difference F Sig tailed) Difference Difference Lower Upper Calcium Equal intake variances 1.867 176 22.098 84.144 -145.526 189.723 (mg/day) assumed Equal variances not 278 69.611 .782 22.098 79.404 -136.283 180.480 assumed
Step by Step Solution
There are 3 Steps involved in it

Get step-by-step solutions from verified subject matter experts