

Question: From the table above, use the Excel Data analysis tool to solve the below, show calculations and formulas on an Excel worksheet, or paste screen
From the table above, use the Excel Data analysis tool to solve the below, show calculations and formulas on an Excel worksheet, or paste screen shots if possible
a) Use = .2 to compute the exponential smoothing forecast for the supermarket sales.
b) Use = .3 to compute the exponential smoothing forecast for the supermarket sales.
c) Use = .4 to compute the exponential smoothing forecast for the supermarket sales.
d) Does a smoothing constant of .2, .3 or .4 appear to provide more accurate forecasts based on MSE? Explain. Note: show your MSE calculations.
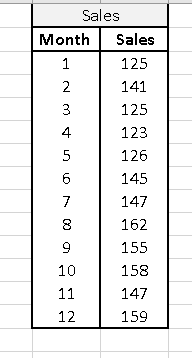
\begin{tabular}{|c|c|} \hline \multicolumn{2}{|c|}{ Sales } \\ \hline Month & Sales \\ \hline 1 & 125 \\ 2 & 141 \\ 3 & 125 \\ 4 & 123 \\ 5 & 126 \\ 6 & 145 \\ 7 & 147 \\ 8 & 162 \\ 9 & 155 \\ 10 & 158 \\ 11 & 147 \\ 12 & 159 \\ \hline \end{tabular}
Step by Step Solution
There are 3 Steps involved in it

Get step-by-step solutions from verified subject matter experts