

Question: From the tables above I have the chart below. The question is how I can describe that chart about 40-50 words 3-5-7 Moving Average Forecast
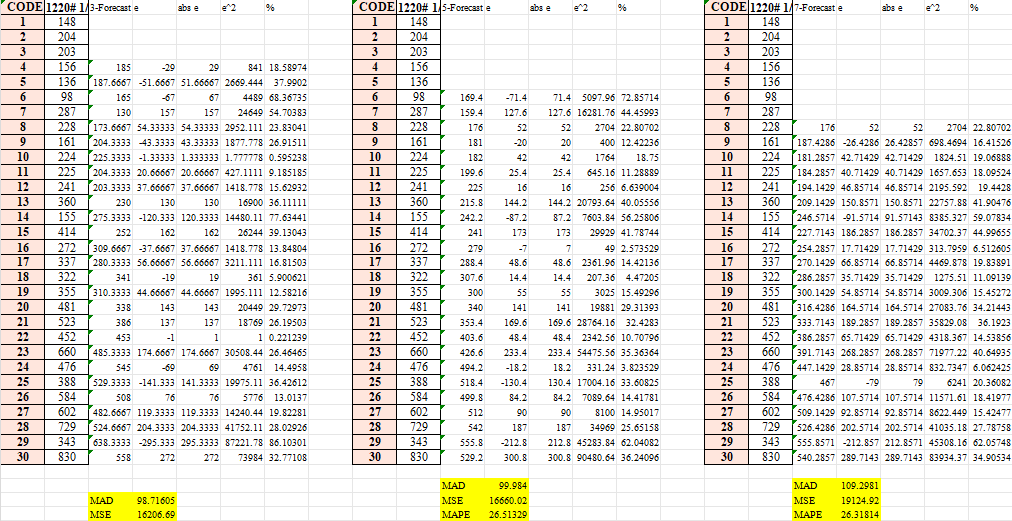
From the tables above I have the chart below. The question is how I can describe that chart about 40-50 words 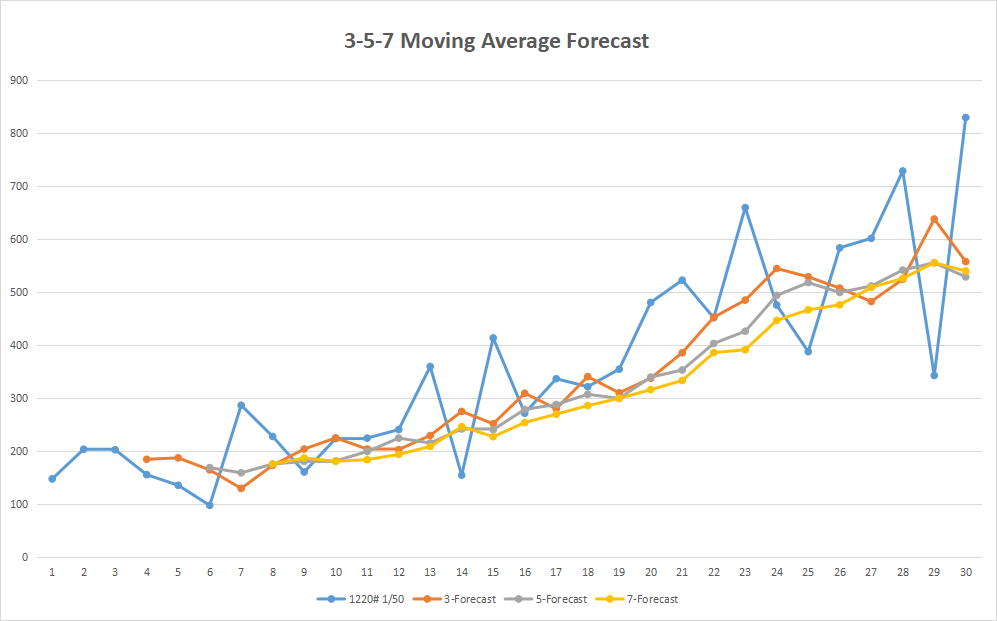
3-5-7 Moving Average Forecast 900 0
Step by Step Solution
There are 3 Steps involved in it
1 Expert Approved Answer
Step: 1 Unlock

Question Has Been Solved by an Expert!
Get step-by-step solutions from verified subject matter experts
Step: 2 Unlock
Step: 3 Unlock