

Question: From the ULM Diagram. ( Java ) Can some one help me with the LineSet class ? I need help with the method +sortBySlope() and
From the ULM Diagram. ( Java )
Can some one help me with the LineSet class ?
I need help with the method +sortBySlope() and increaseBrightseq() please add extra comment so I can understand
2 Lines 2.1 Equations
As you may remember from your math studies, lines can be represented by the equation:
= +
where m represents the slope of the line and b represents the intercept (the place at which the line crosses the y axis). See this site for a review of the basic concepts.
2.2 Intersections
To find the point of intersection of two lines, substitute one lines mx+b value for the other equations y value, then solve for x. For example, find the intersection of lines y = 4x 1 and y = x +19:
4x 1 = x + 19 5x = 20 x=4
You then find the y coordinate by substituting the now-known x: y = 4x 1y = 4(4) 115. So, the intersection of the two lines is at (4,15). See this site for a review of finding the intersection of two lines. Youll need to find a way to do this programmatically, translating the manual steps into code.
3 Brightness
3.1 Calculating Based on RGB
Brightness is calculated based on the red, green, and blue components of a color. The equation for calculating it is as follows; note that the multiplier isnt squared, only the R, G, and B values are.
= 0.2412 + 0.6912 + 0.0682
3.2 Increasing Brightness Sequence
Looking at a sequence of brightness values, youll be asked to find and return the longest sequence of increasing values. For example, given this sequence: 67.8, 91.3, 56.3, 62.3, 87.3, 87.3, 90.4, 55.0, the sequence that would be returned is the sequence of values shown in boldface. Important: in this project, youll be asked to return an array of Line object referencesnot scalar valuesrepresenting this sequence.
4 Input File
4.1 File
The input file will contain the following elements, in order:
-
On the first line, an integer indicating how many Lines are represented in the file.
-
One additional data line per Line, each having doubles representing slope and y intercept followed by
three integers representing the red, green, and blue components of the lines color. The color
elements are in the range of 0 to 255.
-
Data elements are separated by spaces.
4.2 Example Contents
2 4.0 -2.0 240 56 33 1.0 5.0 0 200 175
The example files contents are interpreted as follows:
-
There are two Lines represented in the file
-
The first lines equation is y = 4x 2 and has color R=240, G=56, and B=33.
-
The second lines equation is y = x + 5 and has color R=0, G=200, B=175.
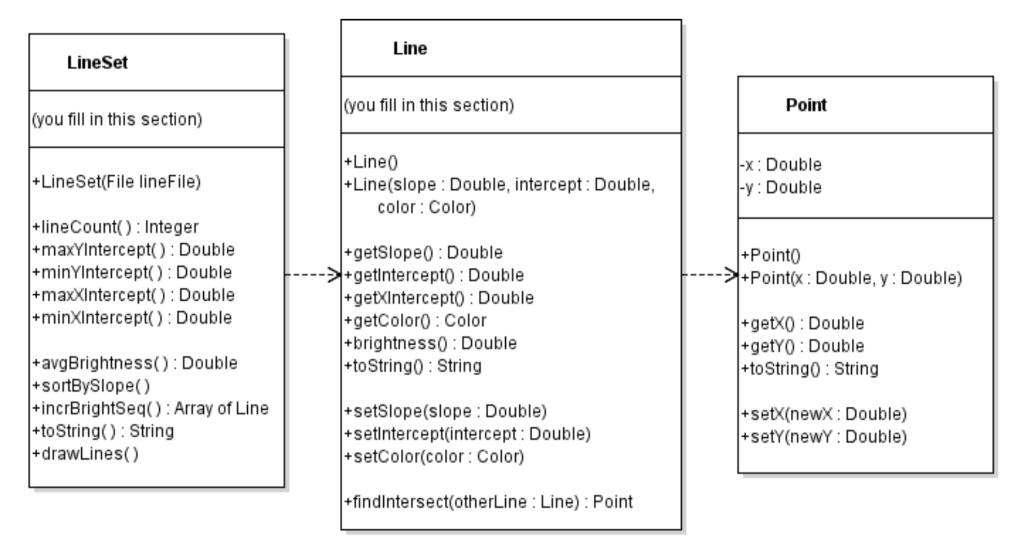
Line Line Set (you fill in this section) Point (you fill in this section) +Line0 Line(slope Double, intercept: Double, x: Double y: Double +LineSet(File lineFile) color: Color) lineCount) Integer +maxYIntercept() Double +minYIntercept) Double +maxXIntercept) Double +minXIntercept() Double +Point0 ->Point(x: Double, y : Double) +getSlope0 Double +getintercepto : Double getXIntercept0 Double +getColor0 Color +brightness0 Double toString0 String getx0 Double getY0 Double toString0 String +avgBrightness() Double +sortBySlope() incrBrightSeq): Array of Line +toString String +drawLines() +setSlope(slope Double) setintercept(intercept Double) +setColor(color: Color) setx(newx: Double) +set (newY : Double) +findlntersect(otherLine Line) Point
Step by Step Solution
There are 3 Steps involved in it

Get step-by-step solutions from verified subject matter experts