

Question: From what you learned in the lectures, do you expect a relationship between the ping loss and the traffic intensity for a given buffer capacity
From what you learned in the lectures, do you expect a relationship between the ping loss and the traffic intensity for a given buffer capacity (for example, decrease or increase with traffic intensity)? Answer yes or no, and justify your answer. Now analyze the reported data for the various configurations. Does the data match the relationship you expected? Same question for the relationship between the ping avg RTT and the traffic intensity.
From what you learned in the lectures, do you expect a relationship between the ping loss and the buffer capacity (for example, decrease or increase with buffer capacity)? Answer yes or no, and justify your answer. Now analyze the reported data for the various configurations. Does the data match the relationship you expected? Same question for the relationship between the ping avg RTT and the buffer capacity.
please answer all the questions throughly, and accordingly to its table 1.
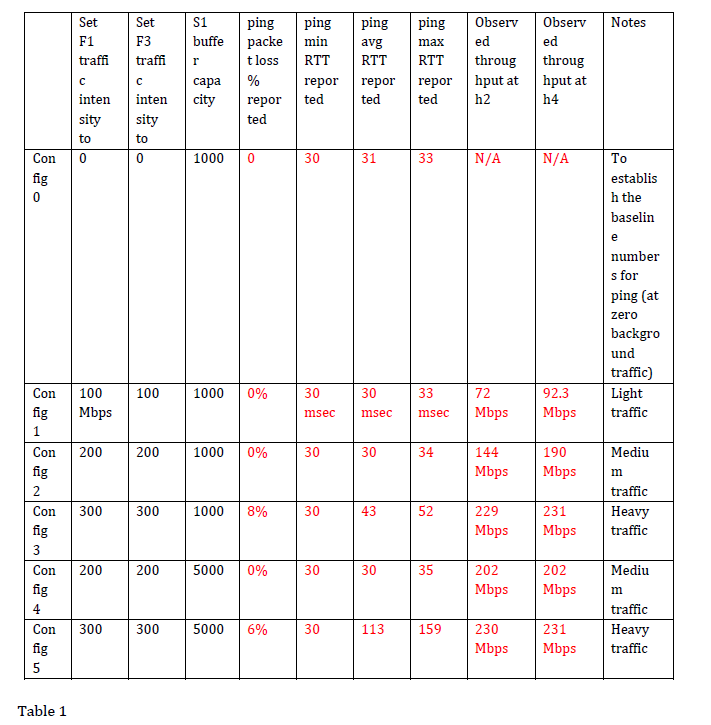
S1 buffe packe minav ping Observ Observ Notes ping ping ping tloss RTTRTTRTT througthroug repor ted F1 F3 trafh trafnI capa |90 repor repor repor hput at hput at inten inten city r sity sity h2 h4 to Con 0 10000 30 N/A N/A establis h the baselin number s for ping (at zero backgro traffic) Light traffic 100 1000 | 0% Con 100 figMbps 30 msec msec msec Mbps 30 72 92.3 Mbps Con 200 200 1000 | 090 30 30 34 144 190 Mediu ps Mbpsm traffic Heavy traffic 1000 | 8% 229 Mbps 231 Mbps Con 300 300 30 43 52 Con 200 5000 | 090 202 Mbps 202 Mbps 200 30 30 35 Mediu traffic Heavy traffic 4 113 231 Mbps Con 300 5000 6% 230 Mbps 300 30 159 Table 1 S1 buffe packe minav ping Observ Observ Notes ping ping ping tloss RTTRTTRTT througthroug repor ted F1 F3 trafh trafnI capa |90 repor repor repor hput at hput at inten inten city r sity sity h2 h4 to Con 0 10000 30 N/A N/A establis h the baselin number s for ping (at zero backgro traffic) Light traffic 100 1000 | 0% Con 100 figMbps 30 msec msec msec Mbps 30 72 92.3 Mbps Con 200 200 1000 | 090 30 30 34 144 190 Mediu ps Mbpsm traffic Heavy traffic 1000 | 8% 229 Mbps 231 Mbps Con 300 300 30 43 52 Con 200 5000 | 090 202 Mbps 202 Mbps 200 30 30 35 Mediu traffic Heavy traffic 4 113 231 Mbps Con 300 5000 6% 230 Mbps 300 30 159 Table 1
Step by Step Solution
There are 3 Steps involved in it

Get step-by-step solutions from verified subject matter experts