

Question: Front Page Campuses * Mobile app R - 2 0 2 4 Spring - Quantitative Analys Bus Dec ( MBAP - 5 1 3 B
Front Page Campuses Mobile app
R Spring Quantitative Analys Bus Dec MBAPB
Time left ::
Question
Not yet
answered
Marked out of
P Flag
question
quen
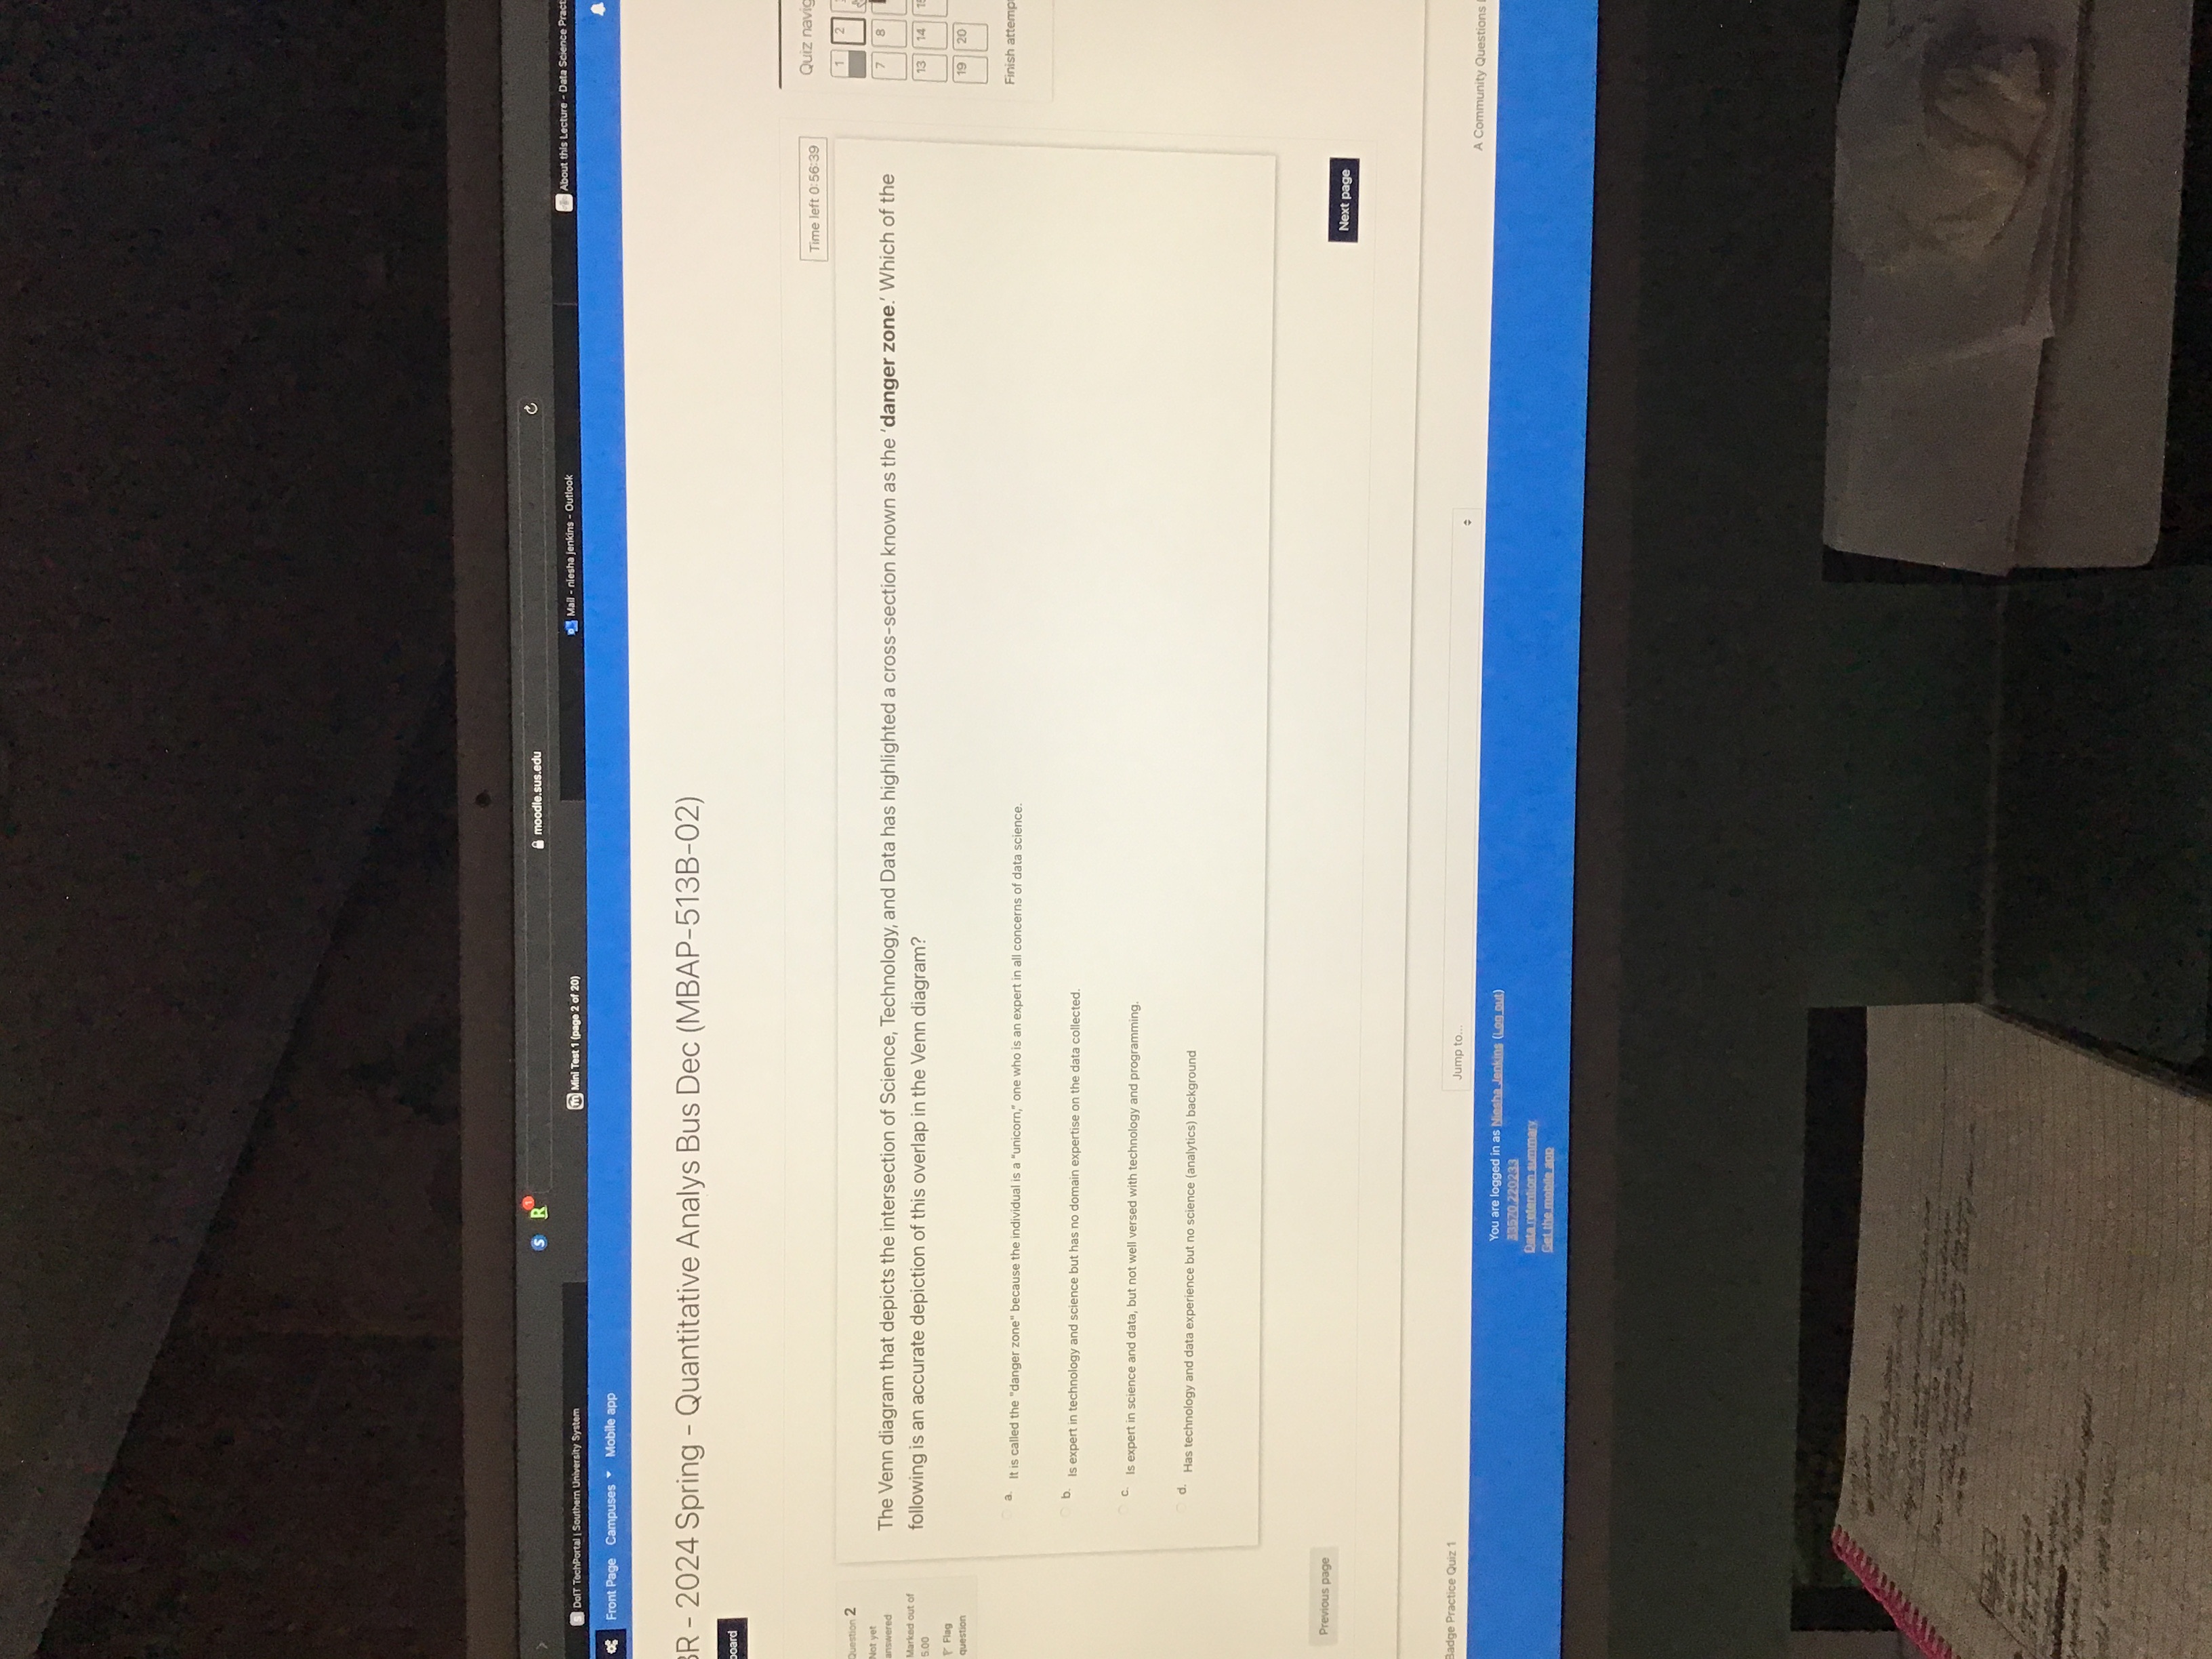
The Venn diagram that depicts the intersection of Science, Technology, and Data has highlighted a crosssection known as the 'danger zone. Which of the following is an accurate depiction of this overlap in the Venn diagram?
a It is called the "danger zone" because the individual is a "unicorn," one who is an expert in all concerns of data science.
b Is expert in technology and science but has no domain expertise on the data collected.
c Is expert in science and data, but not well versed with technology and programming.
d Has technology and data experience but no science analytics background
Previous page
Next page
Step by Step Solution
There are 3 Steps involved in it
1 Expert Approved Answer
Step: 1 Unlock

Question Has Been Solved by an Expert!
Get step-by-step solutions from verified subject matter experts
Step: 2 Unlock
Step: 3 Unlock