Question: fShow / add more layers x + ind Herbal show add more launce /ousklaus2claude 202 1021000 24 246 61 436 Photos - Lab5 Fronts_Page_6.jpg X
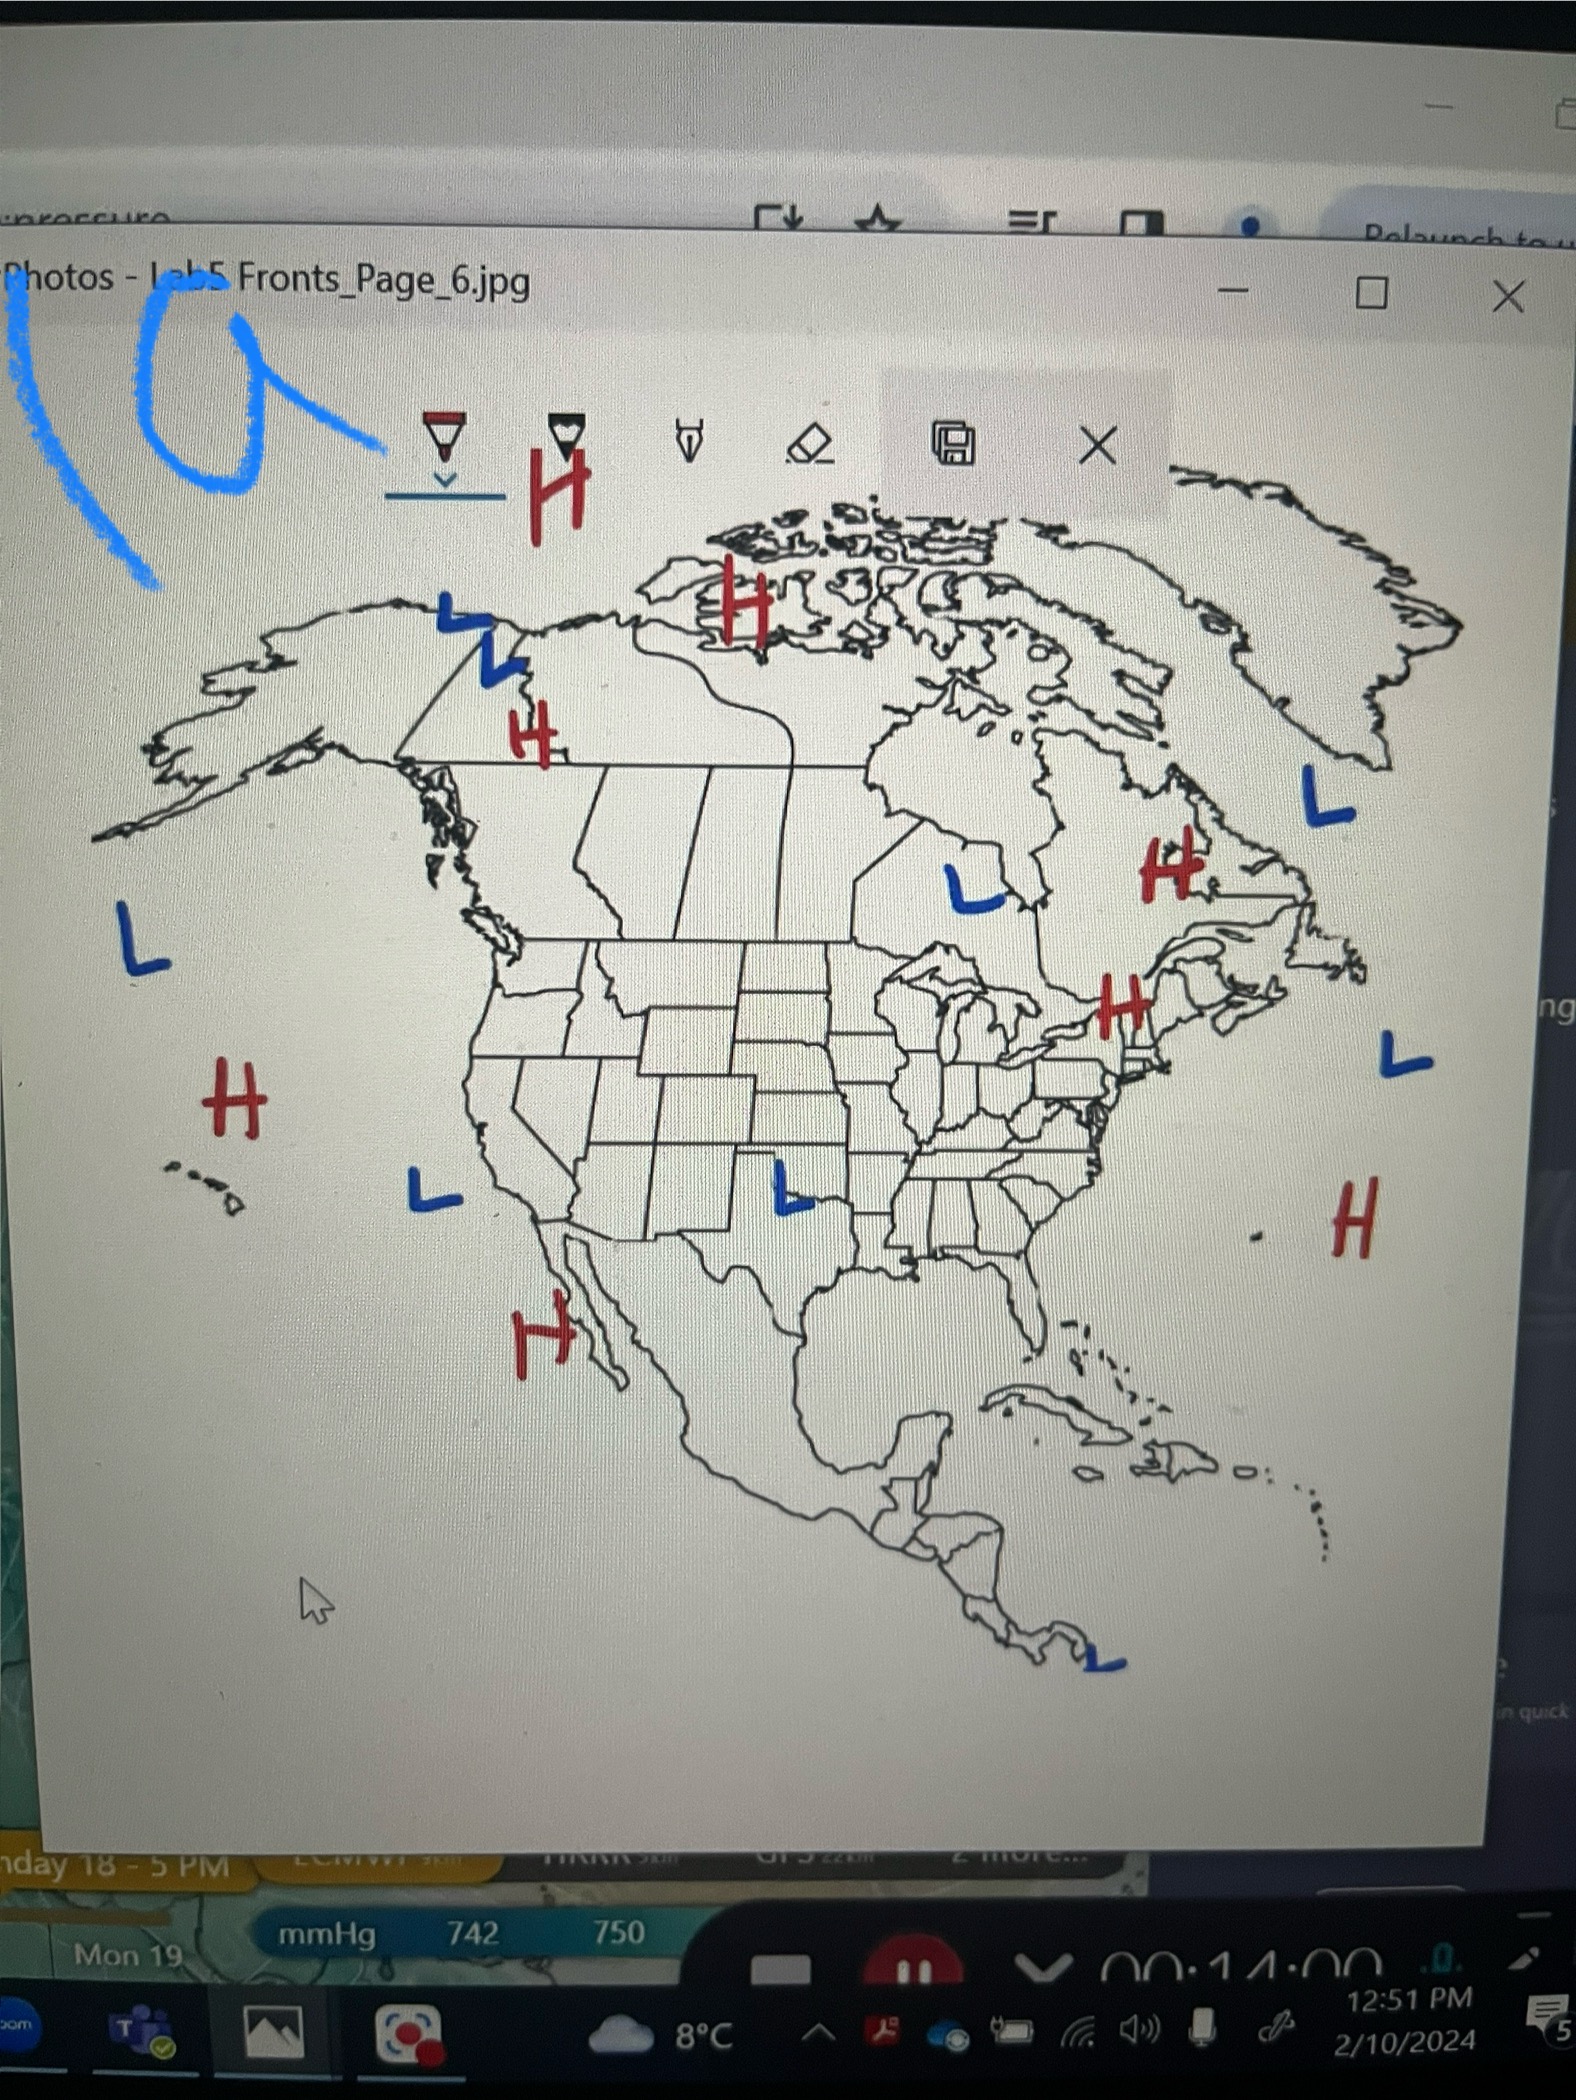
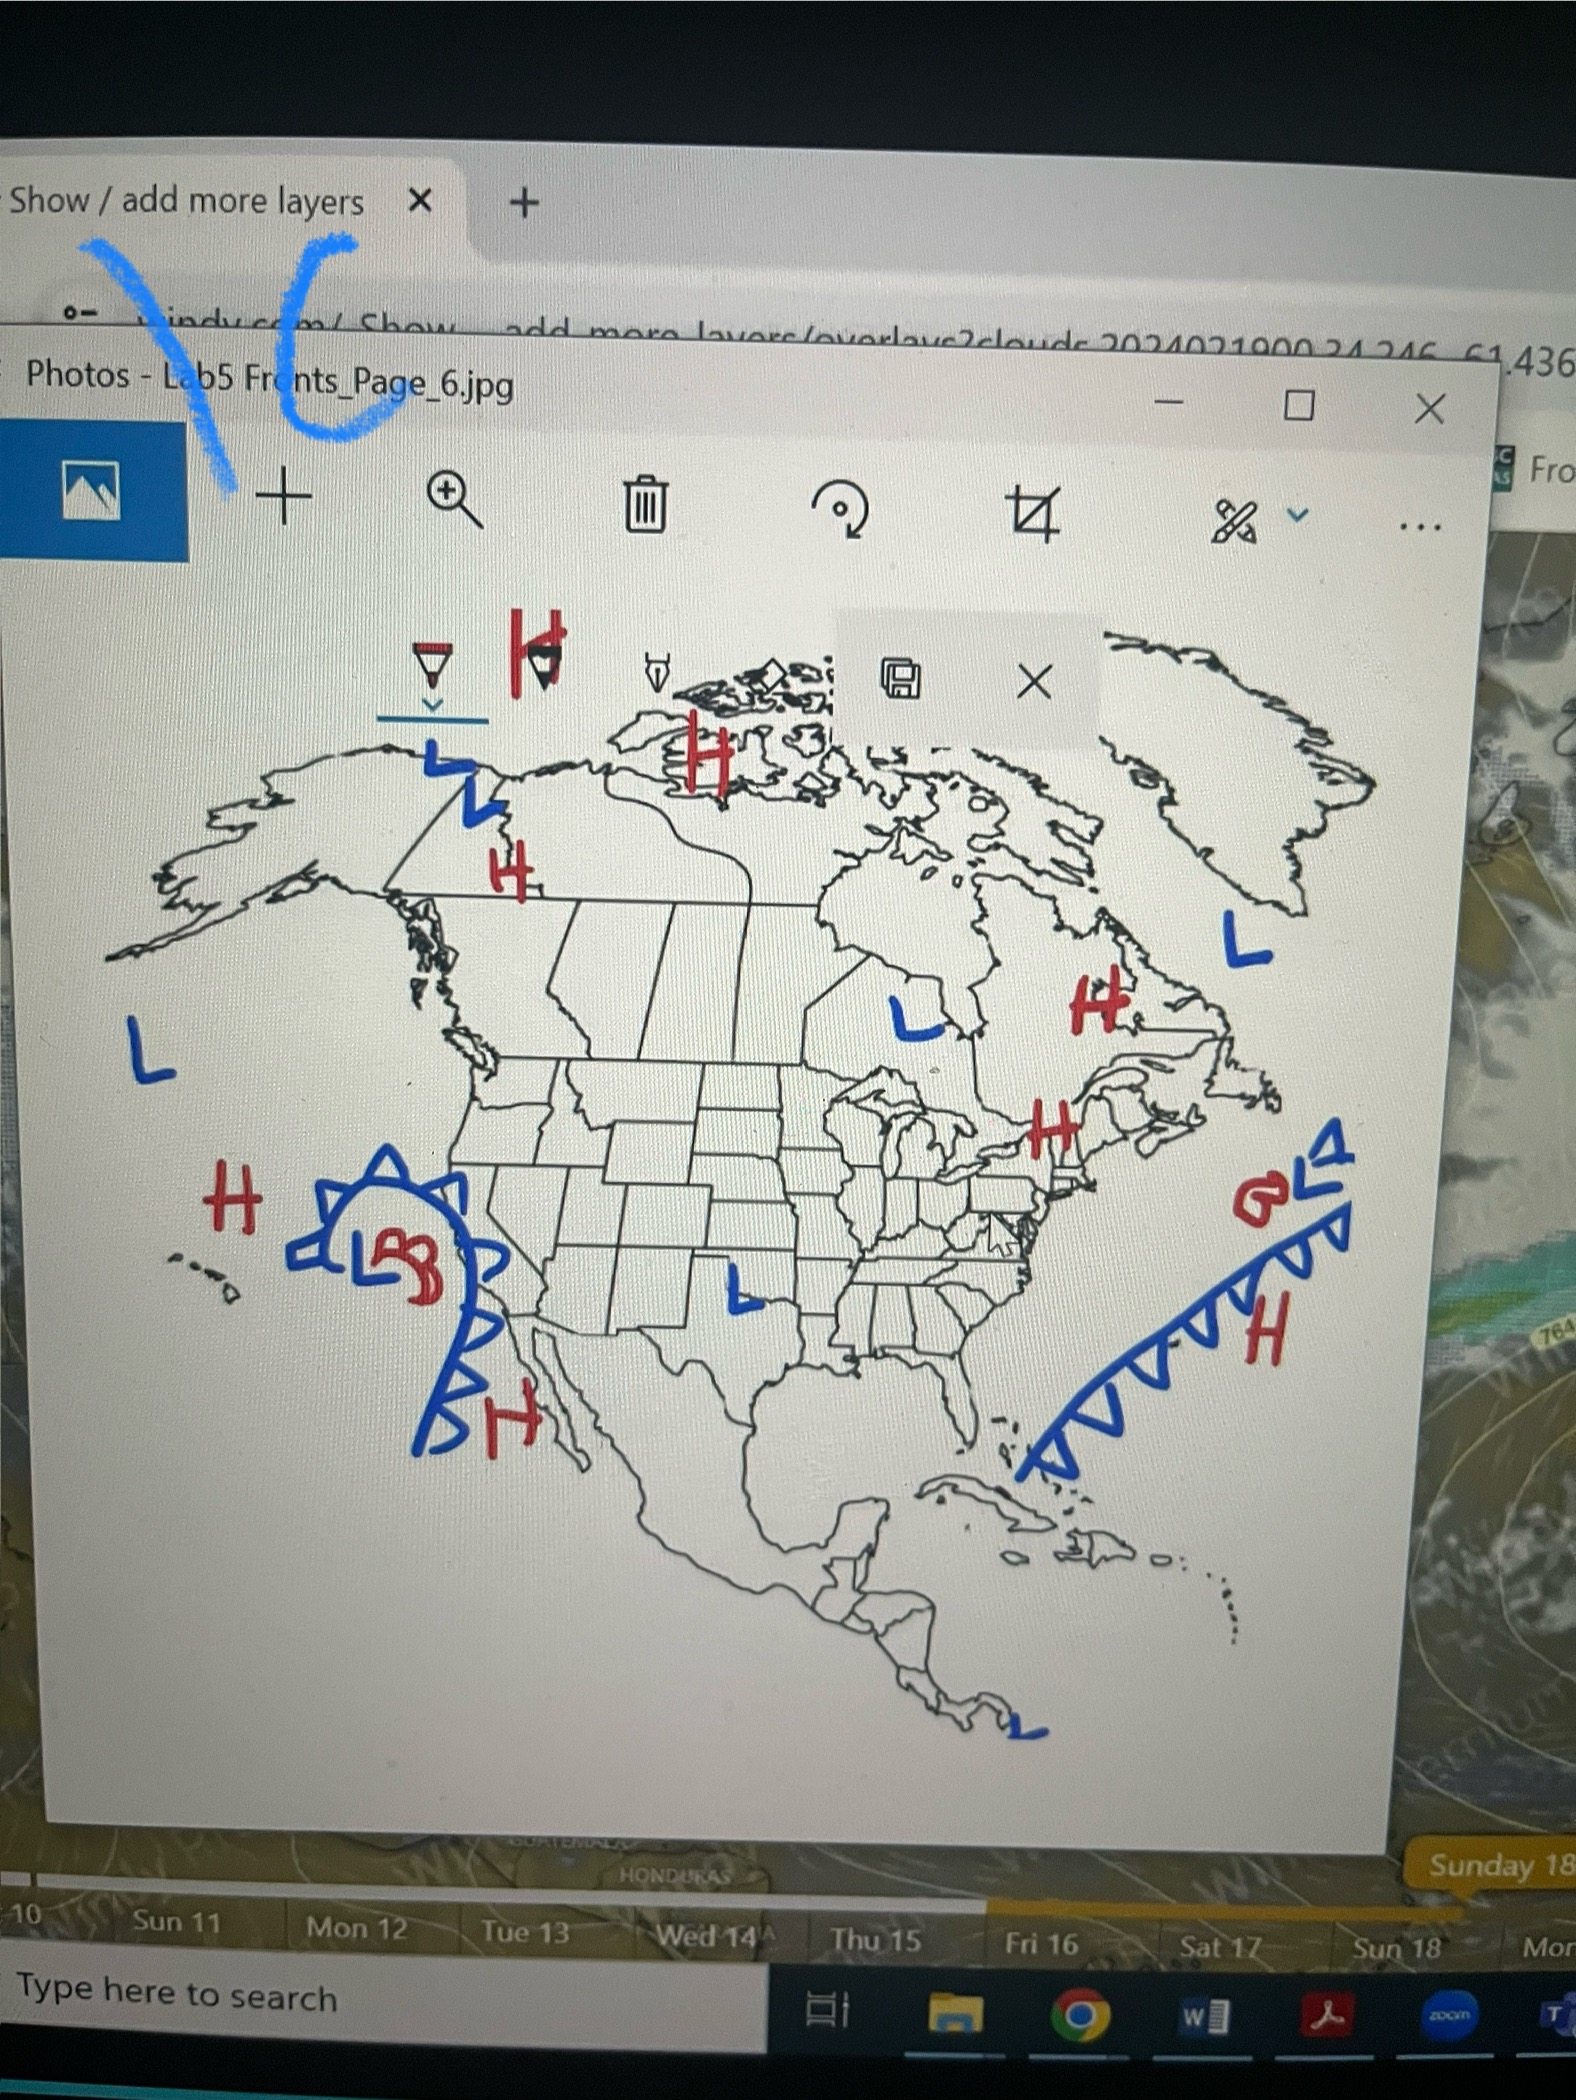
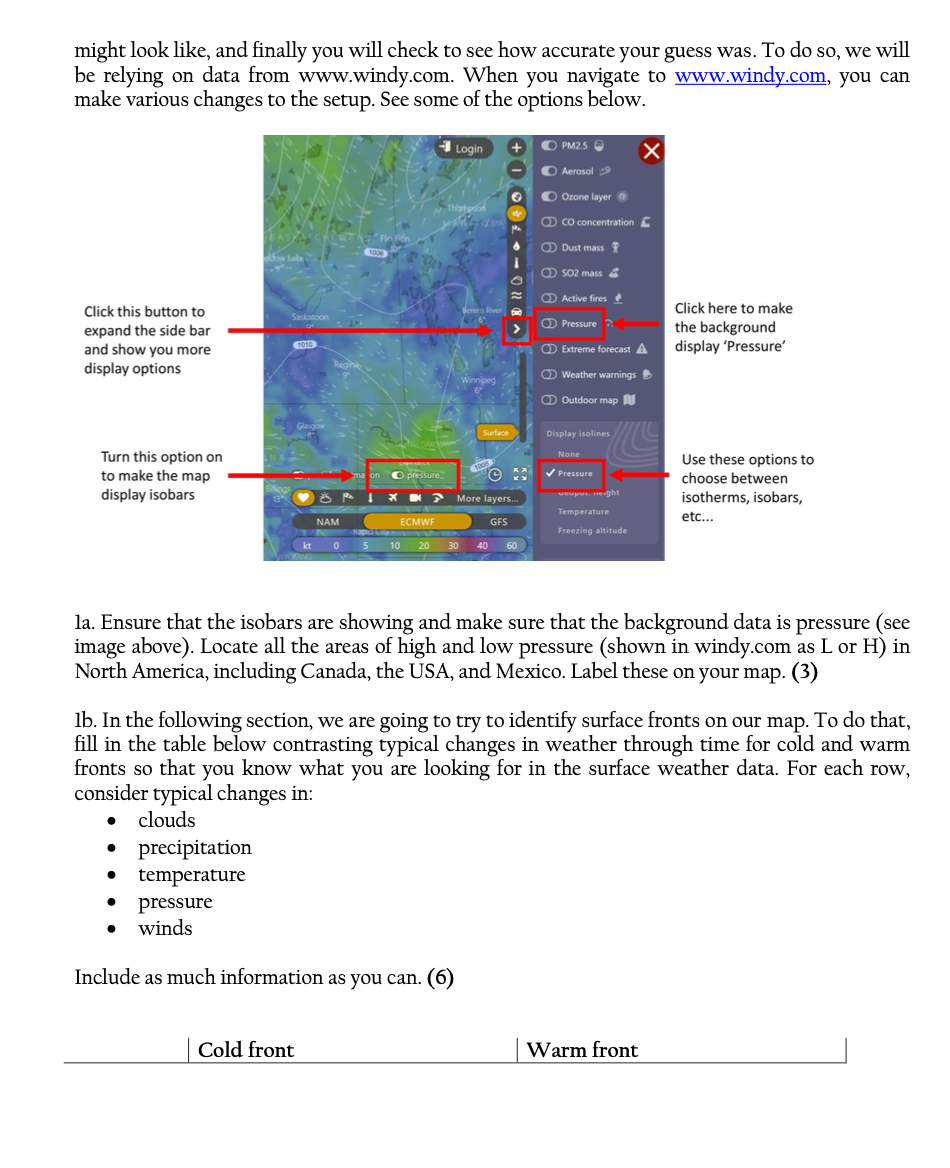
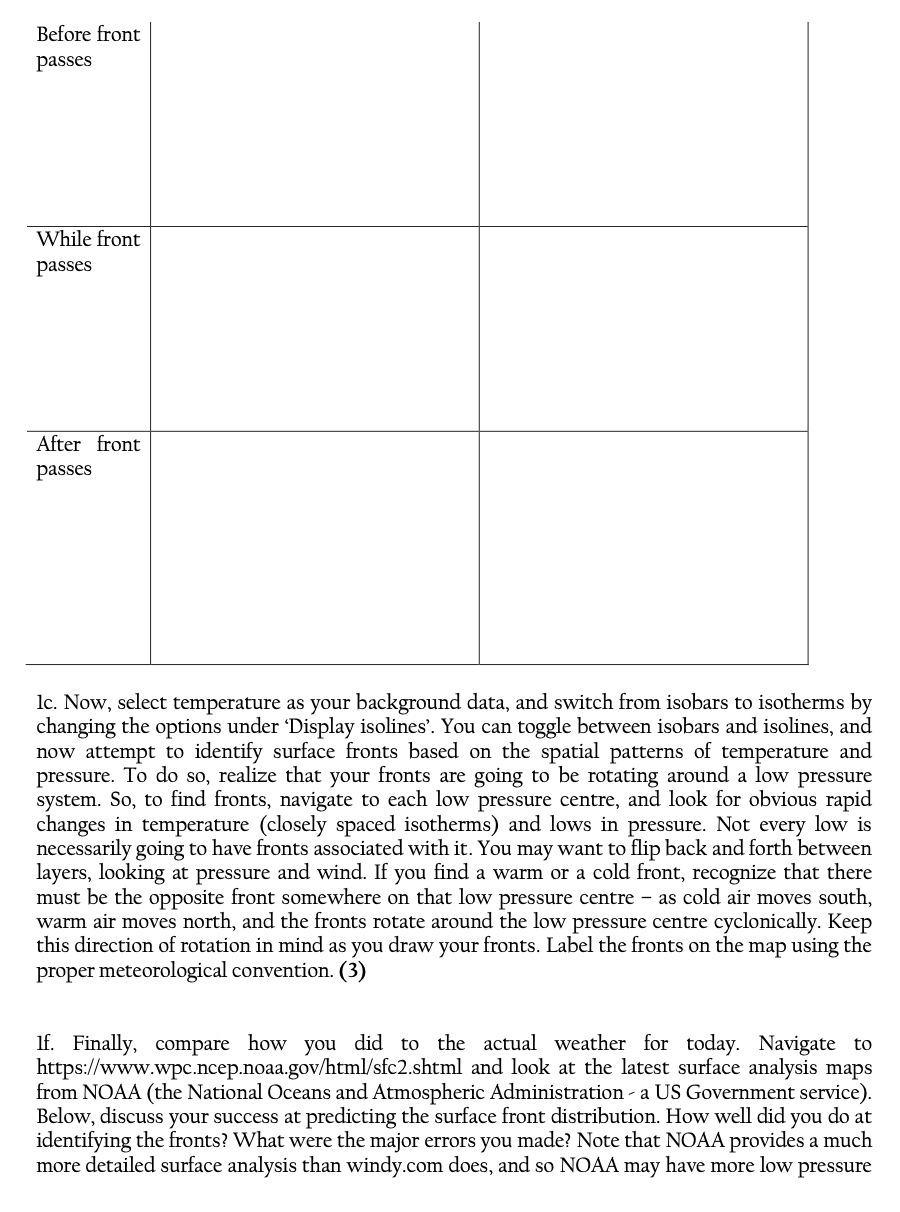
\fShow / add more layers x + ind Herbal show add more launce /ousklaus2claude 202 1021000 24 246 61 436 Photos - Lab5 Fronts_Page_6.jpg X Fro . . . LABP -...s. HONDURAS Sunday 18 10 Sun 11 Mon 12 Tue 13 Wed 144 Thu 15 Fri 16 Sat 17 Sun 18 Mo Type here to search zoommight look like, and finally you will check to see how accurate your guess was. To do so, we will be relying on data from www.windy.com. When you navigate to www-.windy.com, you can make various changes to the setup. See some of the options below. Click here to make the background display 'Pressure' Click this button to expand the side bar and show you more display options Turn this option on to make the map display isobars Use these options to choose between isotherms, isobars, etc... la. Ensure that the isobars are showing and make sure that the background data is pressure (see image above). Locate all the areas of high and low pressure (shown in windy.com as L or H) in North America, including Canada, the USA, and Mexico. Label these on your map. (3) lb. In the following section, we are going to try to identify surface fronts on our map. To do that, fill in the table below contrasting typical changes in weather through time for cold and warm fronts so that you know what you are looking for in the surface weather data. For each row, consider typical changes in: clouds precipitation temperature pressure winds Include as much information as you can. (6) Cold front Warm front | Before front Passes While front passes After front passes lc. Now, select temperature as your background data, and switch from isobars to isotherms by changing the options under 'Display isolines'. You can toggle between isobars and isolines, and now attempt to identify surface fronts based on the spatial patterns of temperature and pressure. To do so, realize that your fronts are going to be rotating around a low pressure system. So, to find fronts, navigate to each low pressure centre, and look for obvious rapid changes in temperature (closely spaced isotherms) and lows in pressure. Not every low is necessarily going to have fronts associated with it. You may want to flip back and forth between layers, looking at pressure and wind. If you find a warm or a cold front, recognize that there must be the opposite front somewhere on that low pressure centre as cold air moves south, warm air moves north, and the fronts rotate around the low pressure centre cyclonically. Keep this direction of rotation in mind as you draw your fronts. Label the fronts on the map using the proper meteorological convention. (3) lf. Finally, compare how you did to the actual weather for today. Navigate to https://www.wpc.ncep.noaa.gov/html/sfc2.shtml and look at the latest surface analysis maps from NOAA (the National Oceans and Atmospheric Administration - a US Government service). Below, discuss your success at predicting the surface front distribution. How well did you do at identifying the fronts? What were the major errors you made? Note that NOAA provides a much more detailed surface analysis than windy.com does, and so NOAA may have more low pressure \f
Step by Step Solution
There are 3 Steps involved in it
1 Expert Approved Answer
Step: 1 Unlock
Question Has Been Solved by an Expert!
Get step-by-step solutions from verified subject matter experts
Step: 2 Unlock
Step: 3 Unlock
Students Have Also Explored These Related Accounting Questions!