

Question: fStandard Normal Distribution Table (page 2) Area - Standard Normal Distribution 0.00 1.01 0.02 0.03 1.04 0.05 0.06 0.07 1.08 0.09 0.0 0.5000 0.5040 0.5080
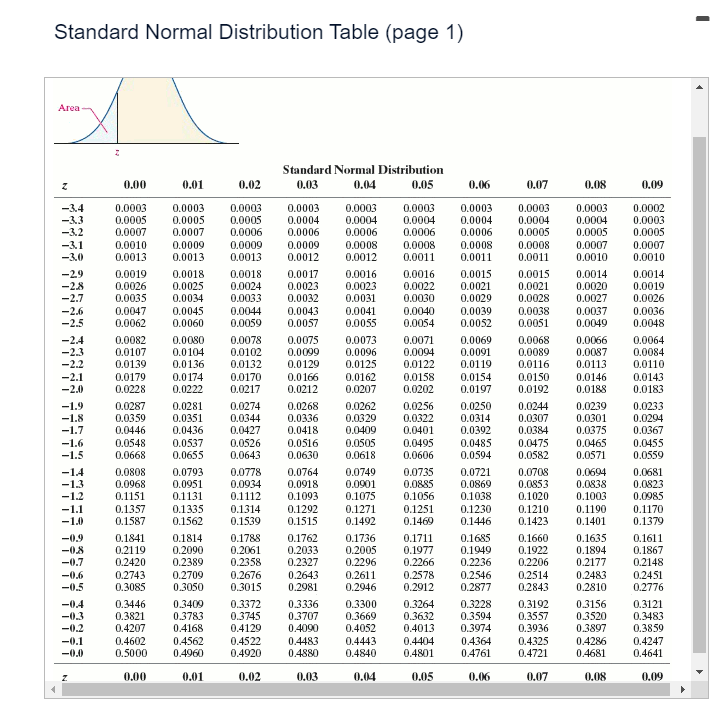
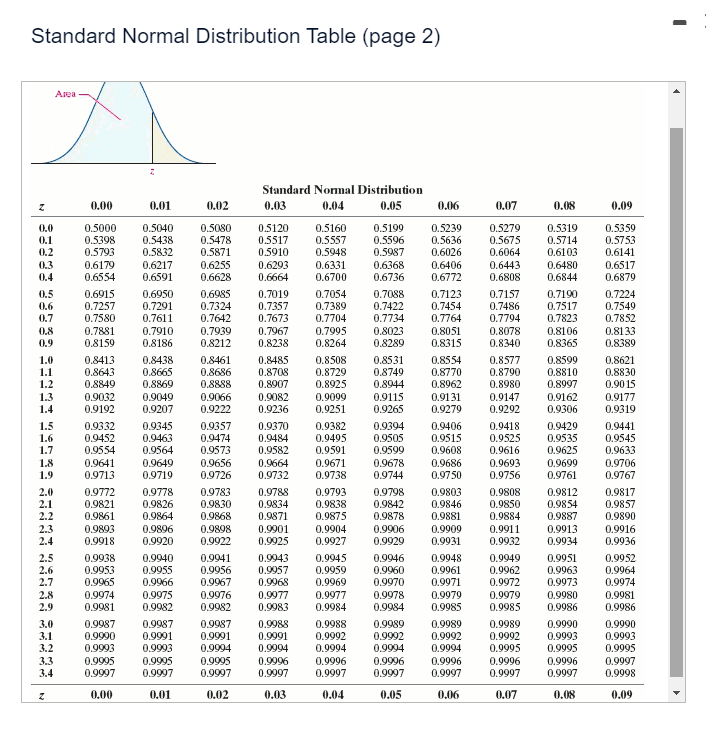


\fStandard Normal Distribution Table (page 2) Area - Standard Normal Distribution 0.00 1.01 0.02 0.03 1.04 0.05 0.06 0.07 1.08 0.09 0.0 0.5000 0.5040 0.5080 0.5120 0.5160 0.5199 3.5239 0.5279 0.5319 0.5359 0.1 0.5398 0.5438 0.5478 0.5517 0.5557 0.5596 0.5636 D.5675 0.5714 0.5753 0.2 0.5793 0.5832 0.5871 0.5910 0.5948 0.5987 0.6026 0.6064 0.61 03 0.6141 0.3 0.6179 0.6217 0.6255 0.6293 0.6331 0.6368 0.6406 0.6443 0.6480 0.6517 0.4 0.6554 0.6591 0.6628 0.6664 0.6700 0.6736 0.6772 D.6808 0.6844 0.6879 0.5 0.6915 0.6950 0.6985 0.7019 0.7054 0.7058 0.7123 0.7157 0.7190 0.7224 0.6 0.7257 0.7291 0.7324 0.7357 0.7389 0.7422 0.7454 0.7486 0.7517 0.7549 0.7 0.7580 0.7611 0.7642 0.7673 0.7704 0.7734 0.7764 0.7794 0.7823 0.7852 0.8 0.7881 0.7910 0.7939 0.7967 0.7995 0.8023 0.8051 0.8078 0.8106 0.8133 0.9 0.8159 0.8186 0.8212 0.8238 0.8264 0.8289 0.8315 D.8340 0.8365 0.8389 1.0 0.8413 0.8438 0.8461 0.8485 D.8508 0.8531 0.8554 0.8577 0.8599 0.8621 1.1 0.8643 1.8665 0.8686 0.8708 0.8729 0.8749 0.8770 0.8790 1.8810 0.8830 0.8997 1.2 0.8849 0.8869 0.8888 0.8907 0.8925 0.8944 0.8962 0.8980 0.90 15 1.3 0.9032 0.9049 0.9056 0.9082 1.9099 0.9115 0.9131 0.9147 0.91 62 0.9177 1.4 0.9192 0.9207 0.9222 0.9236 D.9251 0.9265 0.9279 D.9292 0.9306 0.9319 1.5 0.93.32 0.9345 0.9357 0.9370 D.9382 0.9394 0.9406 0.9418 0.9429 0.9441 1.6 0.9452 0.9463 0.9474 0.9484 0.9495 0.9505 0.9515 0.9525 0.9535 0.9545 1.7 0.9554 0.9564 0.9573 0.9582 0.9591 0.9599 0.9608 0.9616 0.9625 0.9633 1.8 0.9641 0.9649 0.9656 0.9664 0.9671 0.9678 0.9686 0.9693 0.9699 0.9706 1.9 0.9713 0.9719 0.9726 0.9732 0.9738 1.9744 0.9750 0.9756 0.9761 0.9767 2.0 0.9772 0.9778 0.9783 0.9788 0.9793 0.9798 0.9803 0.9808 0.9812 0.9817 2.1 0.9821 0.9826 0.9830 0.9834 1.9838 1.9842 1.9846 1.9850 1.9854 0.9857 2.2 0.9861 0.9864 0.9868 0.987 0.9875 0.9878 0.9881 0.9884 0.9887 0.9890 2.3 0.9893 1.9896 1.9898 0.9901 0.9904 1.9906 0.9909 0.9911 0.9913 0.9916 2.4 0.9918 0.9920 1.9922 0.9925 1.9927 0.9929 1.9931 0.9932 .9934 0.9936 2.5 0.9938 0.9040 0.9041 0.9943 0.9945 0.9046 0.9948 0.9049 0.9951 0.9952 2.6 0.9964 0.9953 0.9955 0.9956 0.9957 0.9959 0.9960 0.9961 0.9962 0.9963 2.7 0.9965 0.9966 0.9967 0.9968 0.9969 0.9970 0.9971 0.9972 0.9973 0.9974 2.8 0.9974 0.9975 1.9976 0.9977 0.9977 0.9978 0.9979 0.9979 3.9980 0.9981 2.9 0.9981 1.9982 1.9982 0.9983 0.9984 0.9954 0.9985 0.9985 0.9986 0.9986 0.9987 0.9987 0.9087 0.9088 0.9988 1.9989 3.9989 0.9989 0.9090 0.9990 3.0 3.1 0.9990 0.9991 0.9991 0.9991 0.9992 0.9992 0.9992 0.9992 0.9993 0.9993 3.2 0.9993 0.9993 0.9994 0.9994 1.9994 0.9994 0.9994 D.9995 0.9995 0.9995 3.3 0.9995 0.9995 0.9095 0.9096 0.9996 0.9096 0.9096 0.9996 0.9096 0.9997 0.9997 0.9997 1.9997 0.9997 0.9997 0.9997 0.9997 D.9997 0.9997 0.9998 0.00 0.01 0.02 1.03 0.04 0.05 0.06 0.07 0.08 0.09A television sports commentator wants to estimate the proportion of citizens who "follow professional football." Complete parts (a) through (c). Click here to view the standard normal distribution table (page 1) Click here to view the standard normal distribution table (page 2). (a) What sample size should be obtained if he wants to be within 2 percentage points with 94% confidence if he uses an estimate of 48% obtained from a poll? The sample size is ]. (Round up to the nearest integer.) (b) What sample size should be obtained if he wants to be within 2 percentage points with 94% confidence if he does not use any prior estimates? The sample size is | |. (Round up to the nearest integer.) (c) Why are the results from parts (a) and (b) so close? O A. The results are close because 0.48(1 - 0.48) = 0.2496 is very close to 0.25. O B. The results are close because the margin of error 2% is less than 5%. O C. The results are close because the confidence 94% is close to 100%
Step by Step Solution
There are 3 Steps involved in it

Get step-by-step solutions from verified subject matter experts