

Question: fStatistics project starts with collecting data. Here is the data for this project Survey for Statistics mjectcsv In this project you will conduct descriptive analysis
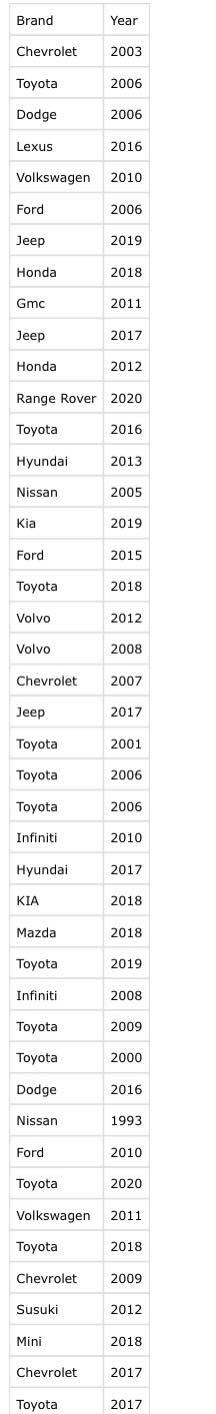
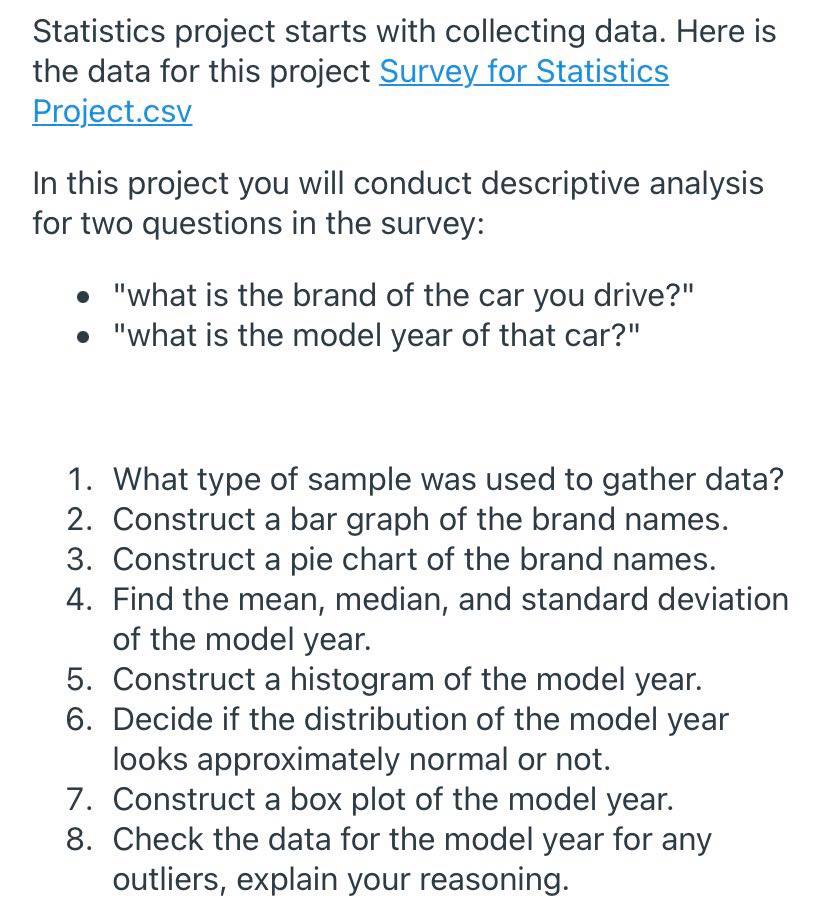
\fStatistics project starts with collecting data. Here is the data for this project Survey for Statistics mjectcsv In this project you will conduct descriptive analysis for two questions in the survey: In "what is the brand of the car you drive?" - "what is the model year of that car?" 1. What type of sample was used to gather data? 2. Construct a bar graph of the brand names. 3. Construct a pie chart of the brand names. 4. Find the mean, median, and standard deviation of the model year. 5. Construct a histogram of the model year. 6. Decide if the distribution of the model year looks approximately normal or not. . Construct a box plot of the model year. . Check the data for the model year for any outliers, explain your reasoning. OOH-l
Step by Step Solution
There are 3 Steps involved in it

Get step-by-step solutions from verified subject matter experts