

Question: fSUMMARY OUTPUT Dependent Variable is Private Average Salary Regression Statistics Multiple R 0.717856406 R Square 0.51531782 Adjusted R Square 0.513771784 Standard Error 18003.918 Observations 630
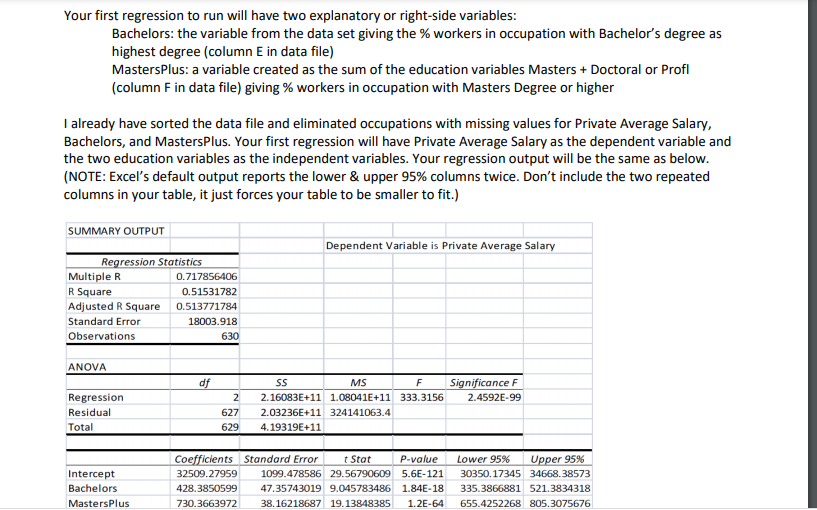
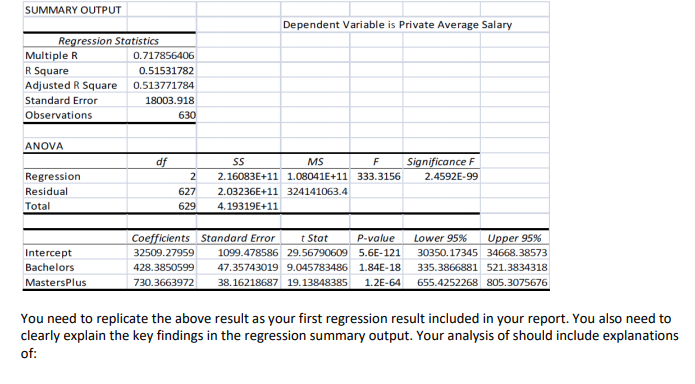
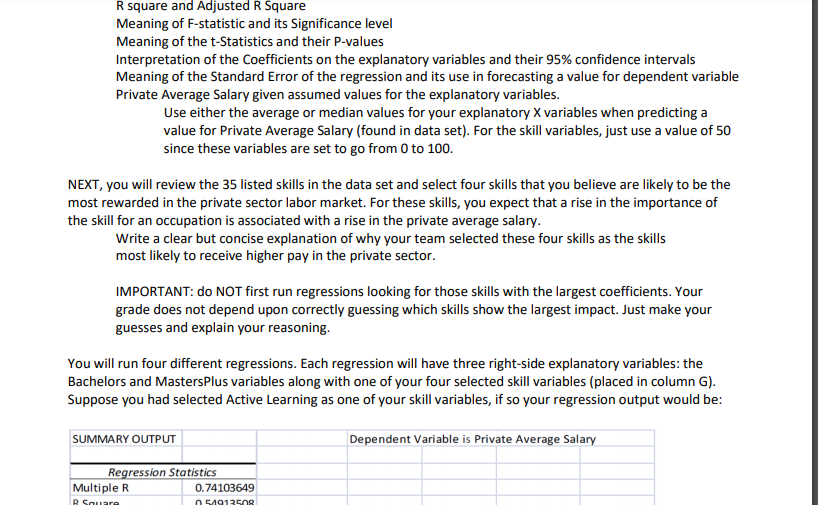
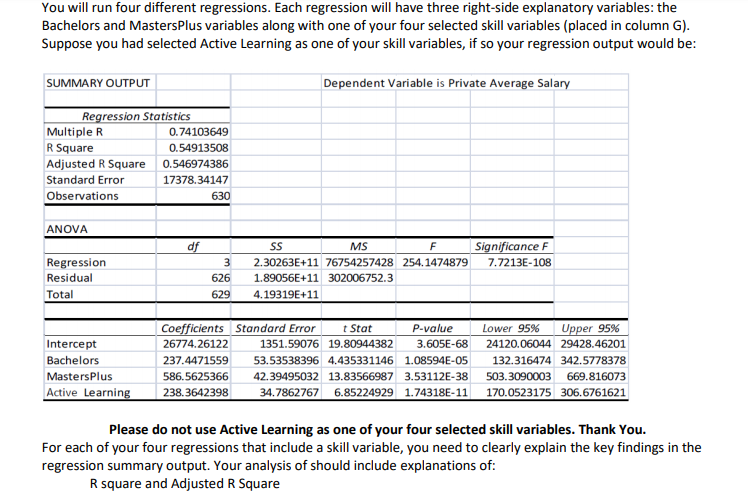
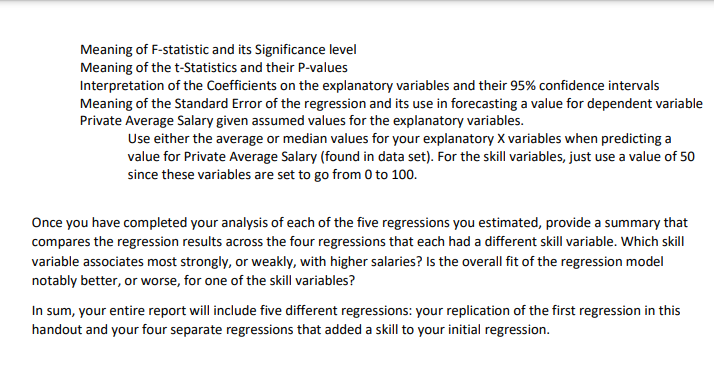
\fSUMMARY OUTPUT Dependent Variable is Private Average Salary Regression Statistics Multiple R 0.717856406 R Square 0.51531782 Adjusted R Square 0.513771784 Standard Error 18003.918 Observations 630 ANOVA of SS MS F Significance F Regression 2 2.16083E+11 1.08041+11 333.3156 2.4592E-99 Residual 627 2.03236E+11 324141063.4 Total 629 4.19319E+11 Coefficients Standard Error t Stat P-value Lower 95%% Upper 95% Intercept 32509.27959 1099.478586 29.56790609 5.6E-121 30350.17345 34668.38573 Bachelors 428.3850599 47.35743019 9.045783486 1.84E-18 335.3866881 521.3834318 MastersPlus 730.3663972 38.16218687 19.13848385 1.2E-64 655.4252268 805.3075676 You need to replicate the above result as your first regression result included in your report. You also need to clearly explain the key findings in the regression summary output. Your analysis of should include explanations of:R square and Adjusted R Square Meaning of F-statistic and its Signicance level Meaning of the t-Statistics and their P-values Interpretation of the Coefcients on the explanatory variables and their 95% condence intervals Meaning of the Standard Error of the regression and its use in forecasting a value for dependent variable Private Average Salary given assumed values for the explanatory variables. Use either the average or median values for your explanatory x variables when predicting a value for Private Average Salary [found in data set}. For the skill va ria bles. just use a value of 5D since these variables are set to go from I] to 10:1 NEIT, you will review the 35 listed skills in the data set and select four skills that you believe are likely to be the most rewarded in the private sector labor market. Forthese skills, you expect that a rise in the importance of the skill for an occupation is associated with a rise in the private ave rage salary. 1ultl'rite a clear but concise explanation of why your team selected these four skills as the skills most likely to receive higher pay in the private sector. IMPORTANT: do NOT first run regressions looking for those skills with the largest coefficients. 'rour grade does not depend upon correctly guessing which skills show the largest impact. Just make your guesses and explain your reasoning. You will run four different regressions. Each regression will have three right-side explanatory variables: the Bachelors and Maste rsPlus variables along with one of your four selected skill variables [placed in column G]. Suppose you had selected Active Learning as one of your skill variables, if so your regression output would be: SUMNER? OUTPUT Dependent 1ill'ariable is Private Average Salaryr Regression Statistics Multiple R 034103549 n can\". n uo-n-zm You will run four different regressions. Each regression will have three right-side explanatory variables: the Bachelors and MastersPlus variables along with one of your four selected skill variables (placed in column G). Suppose you had selected Active Learning as one of your skill variables, if so your regression output would be: SUMMARY OUTPUT Dependent Variable is Private Average Salary Regression Statistics Multiple R 0.74103649 R Square 0.54913508 Adjusted R Square 0.546974386 Standard Error 17378.34147 Observations 630 ANOVA of 55 MS F Significance F Regression 3 2.30263E+11 76754257428 254.1474879 7.7213E-108 Residual 626 1.89056E+11 302006752.3 Total 629 4.19319E+11 Coefficients Standard Error t Stat P-value Lower 95% Upper 95% Intercept 26774.26122 1351.59076 19.80944382 3.605E-68 24120.06044 29428.46201 Bachelors 237.4471559 53.53538396 4.435331146 1.08594E-05 132.316474 342.5778378 MastersPlus 586.5625366 42.39495032 13.83566987 3.53112E-38 503.3090003 669.816073 Active Learning 238.3642398 34.7862767 6.85224929 1.74318E-11 170.0523175 306.6761621 Please do not use Active Learning as one of your four selected skill variables. Thank You. For each of your four regressions that include a skill variable, you need to clearly explain the key findings in the regression summary output. Your analysis of should include explanations of: R square and Adjusted R SquareMeaning of F-statistic and its Signicance level Meaning of the t'Statistics and their P-value-s Interpretation of the Coefcients on the explanatory variables and their 55% condence intervals Meaning of the Standard Error of the regression and its use in forecasting a value for dependent variable Private Average Salary given assumed values for the explanatory variables. Use either the average or median values for your explanatory 1 variables when predicting a value for Private Average Salary [found in data set}. For the skill variables. just use a value of 5D since these variables are set to go from I] to l. Once you have completed your analysis of each of the ve regressions you estimated. provide a summary that compares the regression results across the four regressions that each had a different skill variable. WhiCh skill variable associates most strongly. or weakly, with higher salaries? Is the overall t of the regression model notably bettery or worse, for one of the skill variables? In sum your entire report will include ve different regressions: your replication of the rst regression in this handout and your four separate regressions that added a skill to your initial regression
Step by Step Solution
There are 3 Steps involved in it

Get step-by-step solutions from verified subject matter experts