

Question: fThe random variable x is known to be uniformly distributed between 0.5 and 2. a. 1il'llrhich of the following graphs accurately represents this probability density
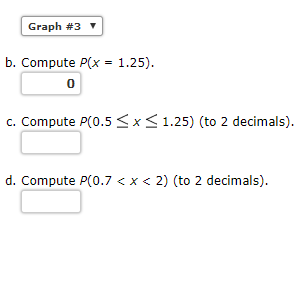
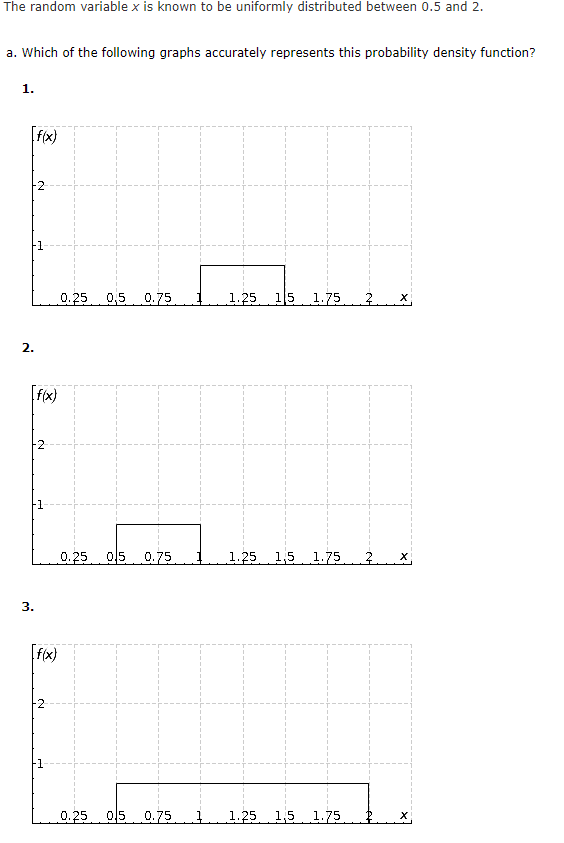
\fThe random variable x is known to be uniformly distributed between 0.5 and 2. a. 1il'llrhich of the following graphs accurately represents this probability density function? 1
Step by Step Solution
There are 3 Steps involved in it
1 Expert Approved Answer
Step: 1 Unlock

Question Has Been Solved by an Expert!
Get step-by-step solutions from verified subject matter experts
Step: 2 Unlock
Step: 3 Unlock