

Question: full chart In this assignment you will conduct a one-way and factorial ANVOA and interpret the results. You will presented with 3 studies: In the
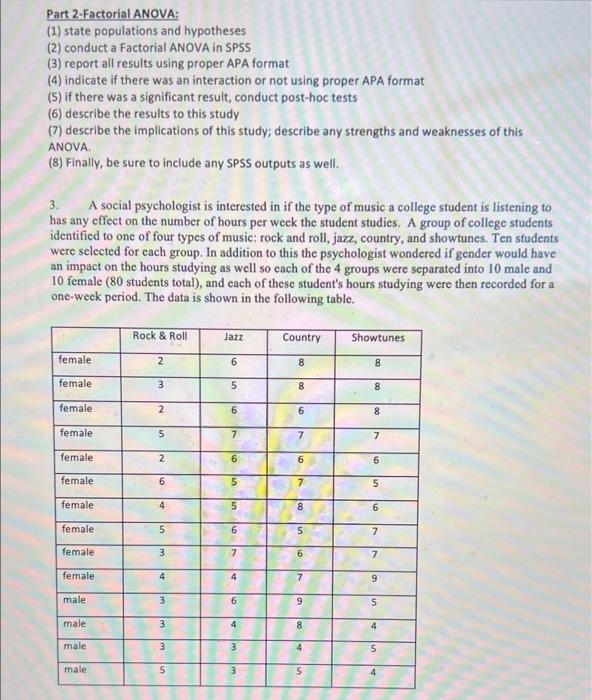
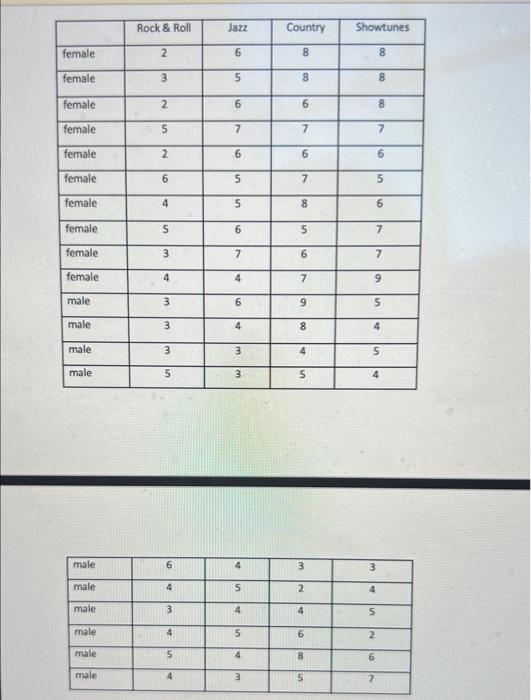
In this assignment you will conduct a one-way and factorial ANVOA and interpret the results. You will presented with 3 studies: In the first two you will (1) state populations and hypotheses; (2) conduct a One-way ANOVA using SPSS; (3) report the results using proper APA format; (4) if there was a significant result, conduct post-hoc tests; (5) describe the results to this study; (6) describe the implications of this study; (7) determine the strengths and weaknesses of the ANOVA. In the third you will (1) state populations and hypotheses; (2) conduct a Factorial ANOVA in SPSS; (3) report all results using proper APA format; (4) indicate if there was an interaction or not using proper APA format; (5) if there was a significant result, conduct post-hoc tests; (6) describe the results to this study; (7) describe the implications of this study; describe any strengths and weaknesses of this ANOVA. Finally, be sure to include any SPSS outputs as well. Part 2-Factorial ANOVA: (1) state populations and hypotheses (2) conduct a Factorial ANOVA in SPSS (3) report all results using proper APA format (4) indicate if there was an interaction or not using proper APA format (5) if there was a significant result, conduct post-hoc tests (6) describe the results to this study (7) describe the implications of this study; describe any strengths and weaknesses of this ANOVA. (8) Finally, be sure to include any SPSS outputs as well. 3. A social psychologist is interested in if the type of music a college student is listening to has any effect on the number of hours per week the student studies. A group of college students identified to one of four types of music: rock and roll, jazz, country, and showtunes. Ten students were selected for each group. In addition to this the psychologist wondered if gender would have an impact on the hours studying as well so each of the 4 groups were separated into 10 male and 10 female (80 students total), and each of these student's hours studying were then recorded for a one-week period. The data is shown in the following table. female female female female female female female female female female male male male male Rock & Roll 2 3 2 5 2 6 4 5 3 4 3 3 3 5 Jazz 6 5 6 7 6 5 5 6 7 4 6 4 3 3 Country 8 8 6 7 6 7 8 5 6 7 9 8 4 5 Showtunes 8 8 8 7 6 5 6 7 7 9 5 4 5 4 female female female female female female female female female female male male male male male male male male male male Rock & Roll 2 3 2 5 2 6 4 5 3 4 3 3 3 5 6 4 3 4 5 4 Jazz 6 5 6 7 6 5 5 6 7 4 6 4 3 3 4 5 4 5 4 3 Country 8 8 6 7 6 7 8 5 6 7 9 00 8 45 3 2 4 6 8 5 Showtunes 8 8 5 6 7 3 8 7 9 5 4 4 7 5 4 S 7 6 2 6
Step by Step Solution
There are 3 Steps involved in it
To approach this assignment follow these steps Part 1 OneWay ANOVA for each study StepbyStep Process 1 State Populations and Hypotheses Population College students listening to different music genres ... View full answer

Get step-by-step solutions from verified subject matter experts