

Question: Full data set For a recent year, the following are the numbers of homicides that occurred each month in a city. Use a 0.05 significance
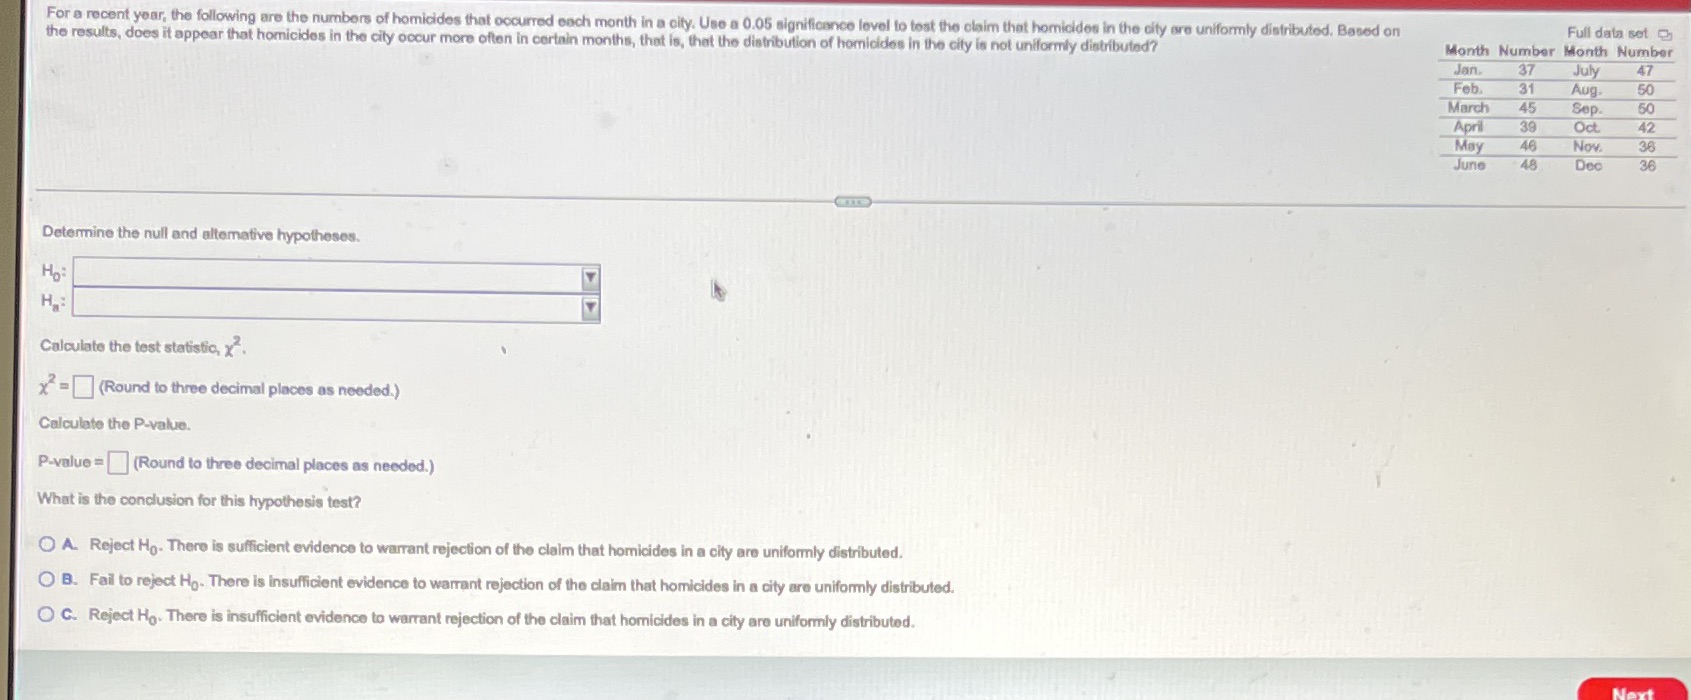
Full data set For a recent year, the following are the numbers of homicides that occurred each month in a city. Use a 0.05 significance level to test the claim that homicides in the city are uniformly distributed, Based on Month Number Month Number the results, does it appear that homicides in the city occur more often in certain months, that is, that the distribution of homicides in the city is not uniformly distributed? Jan 37 July 47 Feb. 31 Aug. 50 March 45 Sep. 50 April 39 Oct 42 May 46 Nov. 36 June 48 Dec 36 Determine the null and alternative hypotheses. H: Calculate the test statistic, x. x = (Round to three decimal places as needed.) Calculate the P-value. P.value = (Round to three decimal places as needed.) What is the conclusion for this hypothesis test? A. Reject Ho. There is sufficient evidence to warrant rejection of the claim that homicides in a city are uniformly distributed. O B. Fail to reject Ho- There is insufficient evidence to warrant rejection of the claim that homicides in a city are uniformly distributed. C. Reject Ho. There is insufficient evidence to warrant rejection of the claim that homicides in a city are uniformly distributed
Step by Step Solution
There are 3 Steps involved in it

Get step-by-step solutions from verified subject matter experts