

Question: Full Year Full Year Full Year Full Year Dec-20 Dec-19 Dec-18 Dec-17 [+] Revenue 163004.00 154839.00 106514.00 102192.00 [+] Cost of Revenue including D&A Expenses
![Dec-17 [+] Revenue 163004.00 154839.00 106514.00 102192.00 [+] Cost of Revenue including](https://dsd5zvtm8ll6.cloudfront.net/si.experts.images/questions/2024/10/66fd8d1a65971_76166fd8d19f0f72.jpg)
![D&A Expenses (119687.00) (118784.00) (83176.00) (79095.00) [+] Depreciation & Amortisation Expenses 5634.00](https://dsd5zvtm8ll6.cloudfront.net/si.experts.images/questions/2024/10/66fd8d1b1233b_76266fd8d1aa13d0.jpg)
| Full Year | Full Year | Full Year | Full Year | |
| Dec-20 | Dec-19 | Dec-18 | Dec-17 | |
| [+] Revenue | 163004.00 | 154839.00 | 106514.00 | 102192.00 |
| [+] Cost of Revenue including D&A Expenses | (119687.00) | (118784.00) | (83176.00) | (79095.00) |
| [+] Depreciation & Amortisation Expenses | 5634.00 | 6216.00 | 6811.00 | 8262.00 |
| [+] Gross Profit | 43317.00 | 36055.00 | 23338.00 | 23097.00 |
find
1.average payment period 2. average collection period
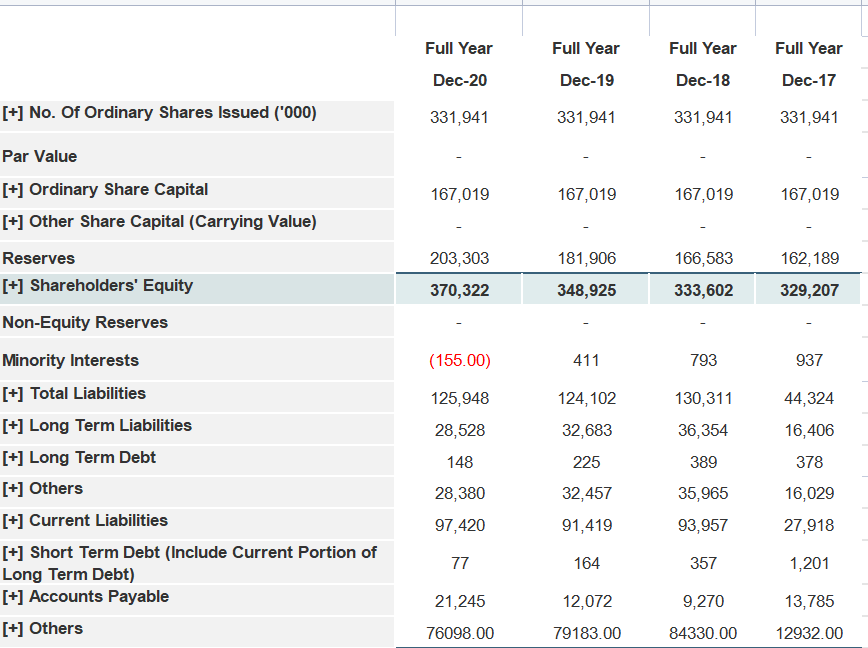
Full Year Dec-20 Full Year Dec-19 Full Year Dec-18 Full Year Dec-17 [+] No. Of Ordinary Shares Issued ('000) 331,941 331,941 331,941 331,941 167,019 167,019 167,019 167,019 162, 189 203,303 370,322 181,906 348,925 166,583 333,602 329,207 (155.00) 411 793 937 Par Value [+] Ordinary Share Capital [+] Other Share Capital (Carrying Value) Reserves [+] Shareholders' Equity Non-Equity Reserves Minority Interests [+] Total Liabilities [+] Long Term Liabilities [+] Long Term Debt [+] Others [+] Current Liabilities [+] Short Term Debt (Include Current Portion of Long Term Debt) [+] Accounts Payable [+] Others 125,948 44,324 124, 102 32,683 130,311 36,354 28,528 16,406 148 225 389 378 28,380 35,965 16,029 32,457 91,419 97,420 93,957 27,918 77 164 357 1,201 12,072 13,785 21,245 76098.00 9,270 84330.00 79183.00 12932.00 97,420 91,419 93,957 27,918 77 164 357 1,201 21,245 9,270 13,785 84330.00 12932.00 12,072 79183.00 473438.00 58478.00 76098.00 496115.00 45203.00 5910.00 374469.00 464706.00 64181.00 56159.00 5910.00 5910.00 4932.00 [+] Current Liabilities [+] Short Term Debt (Include Current Portion of Long Term Debt) [+] Accounts Payable [+] Others [+] Total Equity, MI & Liabilities [+] Fixed Assets [+] Intangible Assets [+] Investments [+] Other Non-Current Assets [+] Current Assets [+] Cash and Short Term Investments [+] Accounts Receivable [+] Inventory [+] Others [+] Total Assets [+] Net Tangible Assets 23546.00 23611.00 23666.00 26111.00 421456.00 370950.00 287267.00 385439.00 97655.00 110816.00 112927.00 156341.00 49338.00 15480.00 42814.00 79933.00 224495.00 234617.00 214156.00 77583.00 6211.00 3829.00 28387.00 10529.00 496115.00 473438.00 464706.00 374469.00 364412.00 343015.00 327692.00 324275.00 (110591.00) (97266.00) (112181.00) (154762.00) 237791.00 90691.00 67861.00 108408.00 (Long Term Debt + Short Term Debt - Cash and Short Term Investments) [+] Enterprise Value (Market Cap + Other Share Capital + Minority Interests + Net Debt) [+] Net Asset Value (NAV) Per Share - Historical [RM] (Based on number of shares at end of period) [+] Net Tangible Asset (NTA) Per Share - Historical [RM] (Based on number of shares at end of period) 1.12 1.05 1.01 0.99 1.10 1.03 0.99 0.98
Step by Step Solution
There are 3 Steps involved in it

Get step-by-step solutions from verified subject matter experts