

Question: Function: create_df: This function takes the Excel sheet 'MostNotSolved.xIsx' and creates a DataFrame which contains all the same information (Year, Agency, State, Homicides, Clearances, Solved)
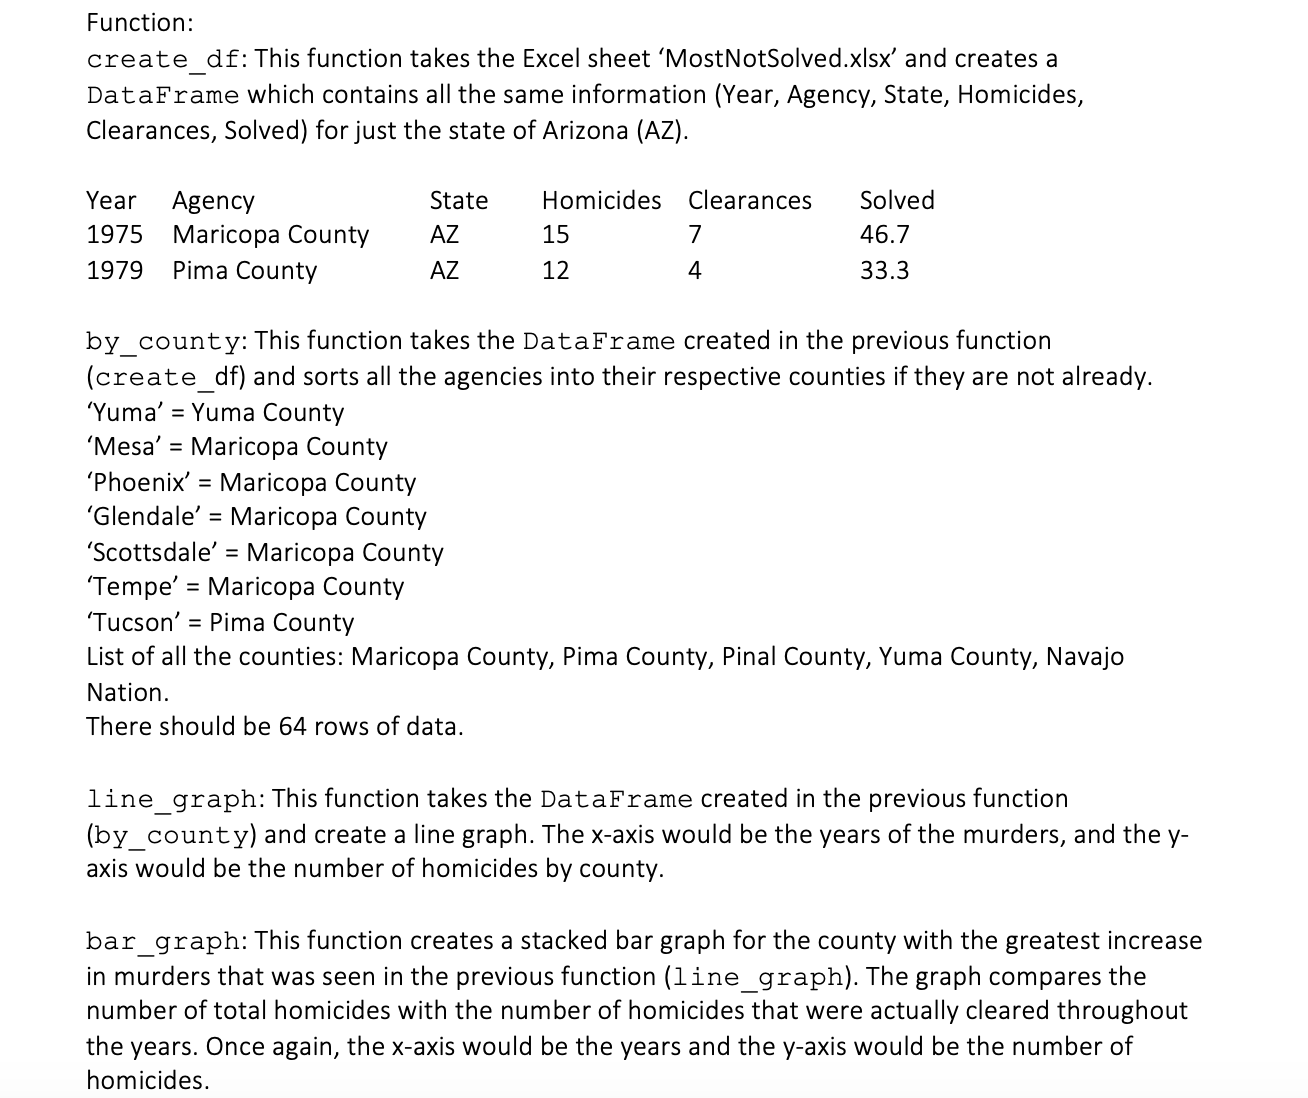

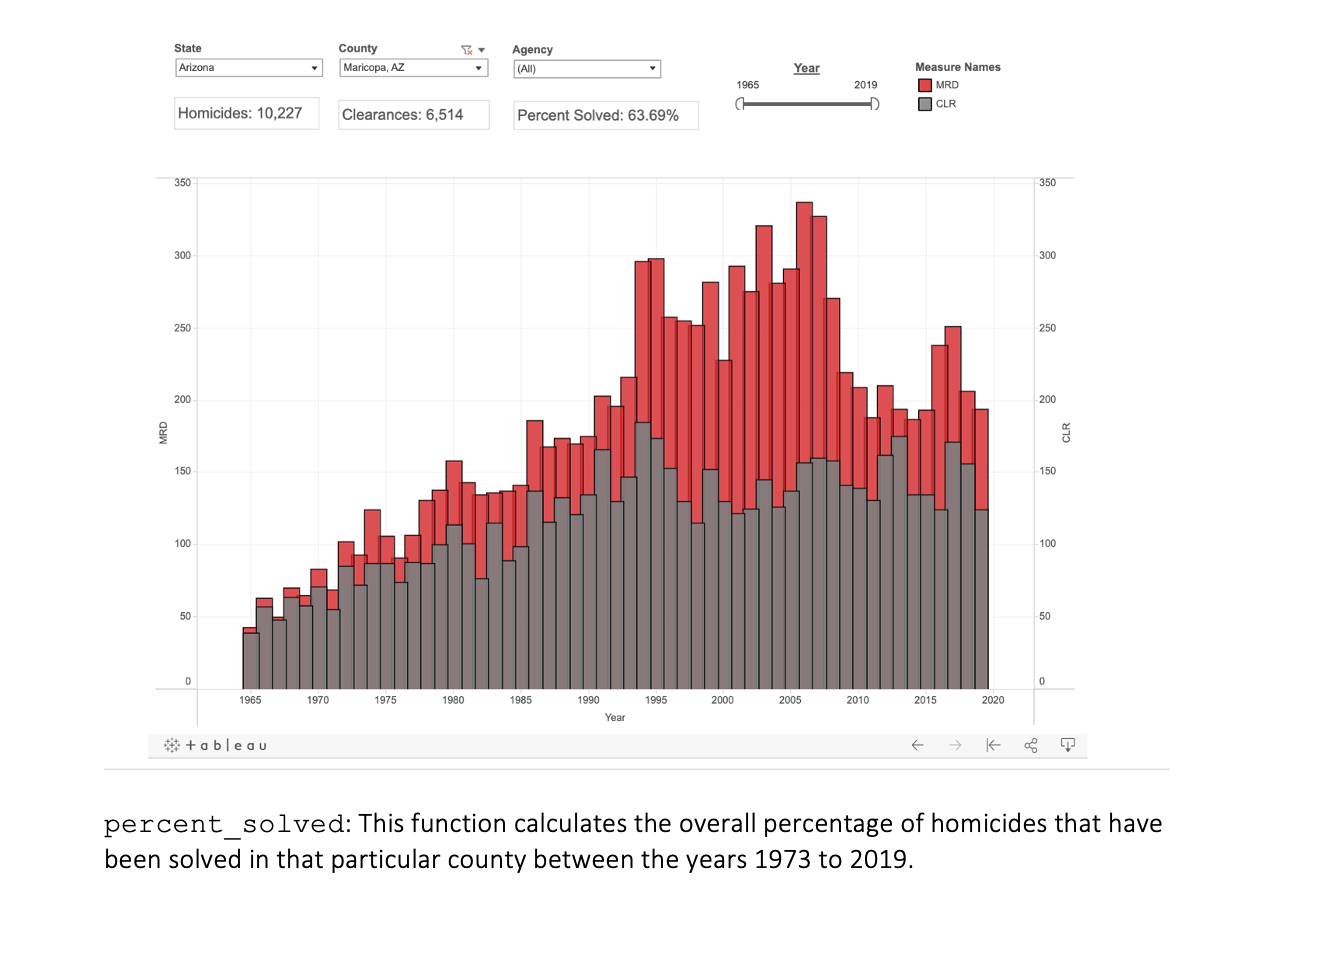
Function: create_df: This function takes the Excel sheet 'MostNotSolved.xIsx' and creates a DataFrame which contains all the same information (Year, Agency, State, Homicides, Clearances, Solved) for just the state of Arizona (AZ). Year Agency State Homicides Clearances Solved 1975 Maricopa County AZ 15 46.7 1979 Pima County AZ 12 33.3 by_county: This function takes the DataFrame created in the previous function (create_df) and sorts all the agencies into their respective counties if they are not already. 'Yuma' = Yuma County 'Mesa' = Maricopa County 'Phoenix' = Maricopa County 'Glendale' = Maricopa County 'Scottsdale' = Maricopa County 'Tempe' = Maricopa County 'Tucson' = Pima County List of all the counties: Maricopa County, Pima County, Pinal County, Yuma County, Navajo Nation. There should be 64 rows of data. line_graph: This function takes the DataFrame created in the previous function (by_county) and create a line graph. The x-axis would be the years of the murders, and the y- axis would be the number of homicides by county. bar_graph: This function creates a stacked bar graph for the county with the greatest increase in murders that was seen in the previous function (line_graph). The graph compares the number of total homicides with the number of homicides that were actually cleared throughout the years. Once again, the x-axis would be the years and the y-axis would be the number of homicides.If Maricopa County had the greatest increase, for example, the graph should look something like this: State County Agency Arizona Maricopa, AZ (All) Year Measure Names 1965 2019 MRD CLR Homicides: 10,227 Clearances: 6,514 Percent Solved: 63.69% -350 350 300 300 250 250 200 200 CLR MRD 150 150 100 100 50 50 0 0 1965 1970 1975 1980 1985 1990 1995 2000 2005 2010 2015 2020 Year #tableau K percent solved: This function calculates the overall percentage of homicides that have been solved in that particular county between the years 1973 to 2019
Step by Step Solution
There are 3 Steps involved in it

Get step-by-step solutions from verified subject matter experts