

Question: function plotCandlestickChart ( app , data ) % Ensure the input data is in the correct format if ~istable ( data ) | | width
function plotCandlestickChartapp data
Ensure the input data is in the correct format
if ~istabledata widthdata
errorInput data must be a table with at least six columns: Date, Open, High, Low, Close, Volume';
end
Extract data from the table
dates data:'Date'; Use named columns for clarity
open data:'Open';
high data:'High';
low data:'Low';
close data:'Close';
volume data:'Volume';
Create a datetime vector from the date column
if ~isadates 'datetime'
Check if dates are in datenum format and convert to datetime
if isnumericdates
dates datetimedates 'ConvertFrom', 'datenum';
else
Try converting from common date string formats
dates datetimedates;
end
end
Ensure dates are sorted in increasing order
dates sortIdx sortdates;
open opensortIdx;
high highsortIdx;
low lowsortIdx;
close closesortIdx;
volume volumesortIdx;
Clear existing plots
claappUIAxes; Clear the axes before plotting
Plot the candlestick chart
candleappUIAxes, open, high, low, close, 'blue'; Customize candlestick appearance
ylabelappUIAxes, 'Price';
Set XTicks for datetime values
numTicks ; Number of ticks
tickInterval maxfloorlengthdates numTicks;
xticks dates:tickInterval:end;
app.UIAxes.XTick xticks; Directly use datetime for UIAxes
app.UIAxes.XTickLabelRotation ;
Automatically set YTicks
yMin minlow;
yMax maxhigh;
ylimappUIAxes, yMin yMax; Set Yaxis limits based on data
yticksappUIAxes, 'auto'; Automatically choose Yticks based on limits
Set X and Y labels explicitly
xlabelappUIAxes, 'Date';
ylabelappUIAxes, 'Price';
end
Code outputs error "Value must be a numeric vector whose values increase.
Error in CopyofHistoricalDataAnalysisAnalyzeNowButtonPushed line
plotCandlestickChartapp app.Data;
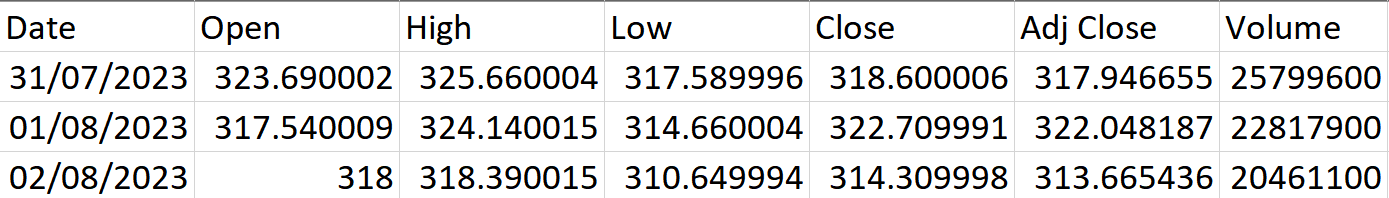
Sample table can be seen in the image.
tableDateOpen,High,Low,Close,Adj Close,Volume
Step by Step Solution
There are 3 Steps involved in it
1 Expert Approved Answer
Step: 1 Unlock

Question Has Been Solved by an Expert!
Get step-by-step solutions from verified subject matter experts
Step: 2 Unlock
Step: 3 Unlock