

Question: Functions In this project things are a bit different from the previous one. You won't write a monolithic program as you did in project 1,
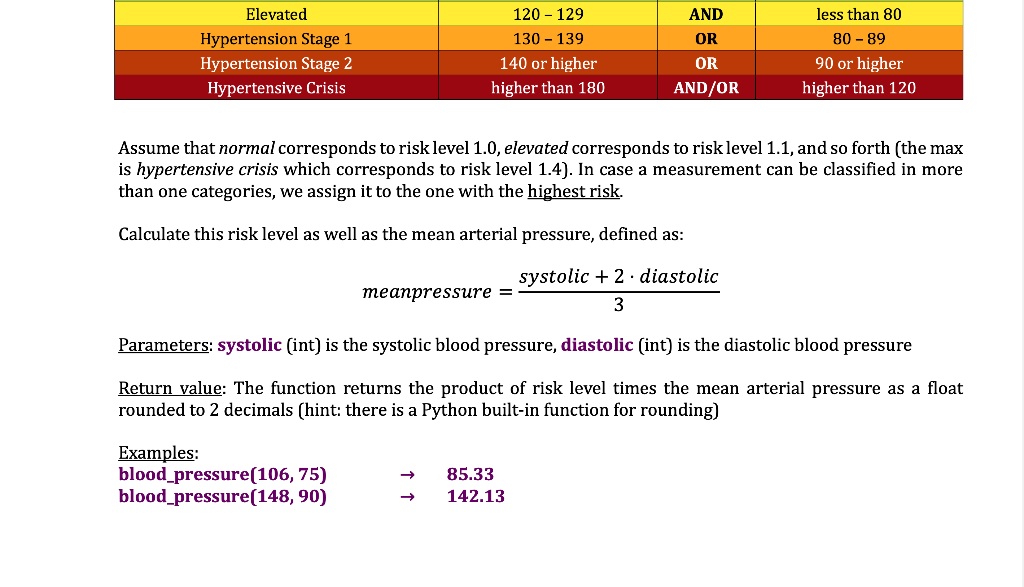
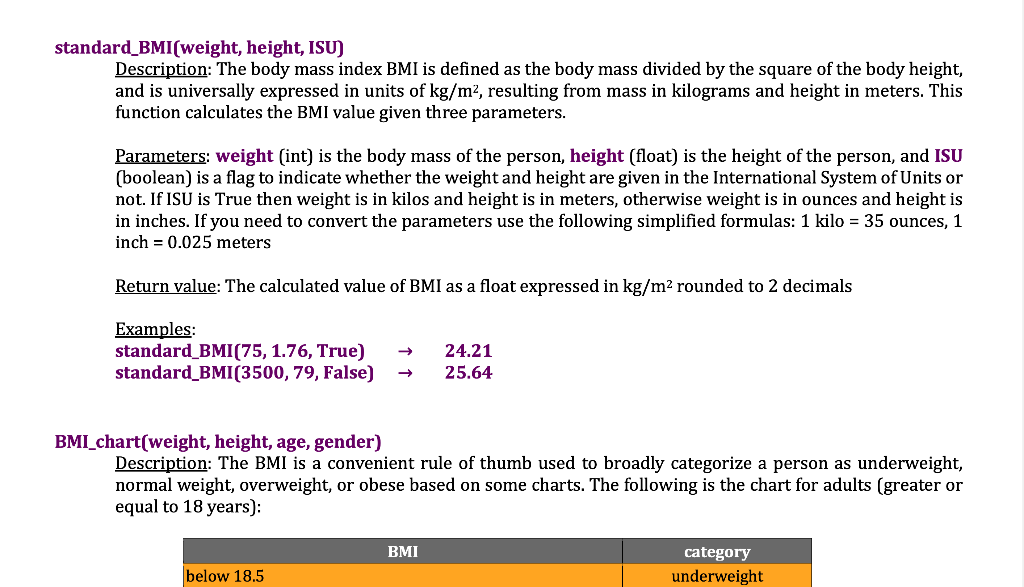
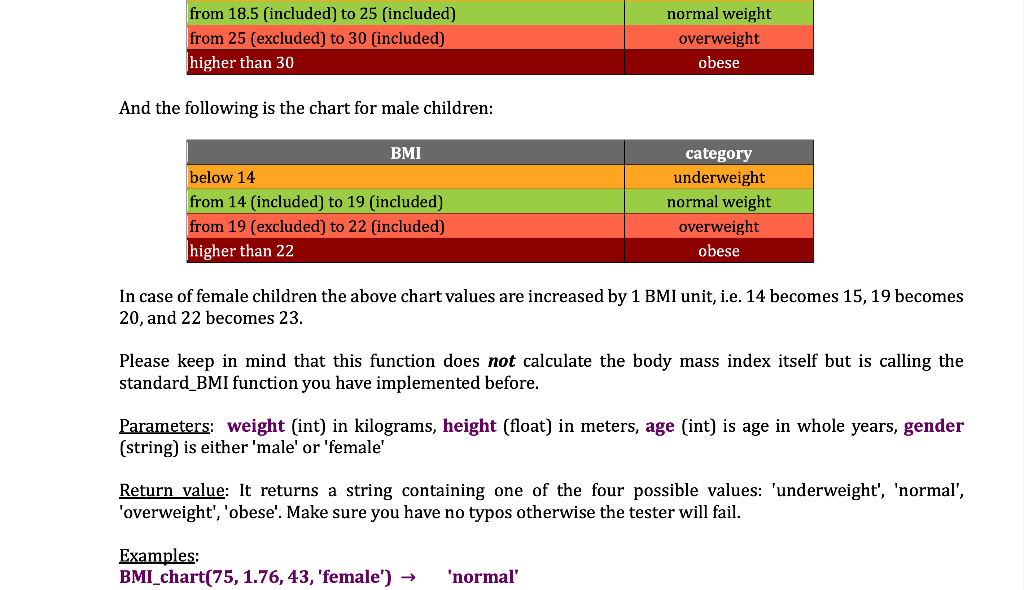
Functions In this project things are a bit different from the previous one. You won't write a monolithic program as you did in project 1, but you're going to implement the following functions. The signature of each function is provided below, do not make any changes to them otherwise the tester will not work properly. Keep in mind that you do not have to write a main body for your program in this project. You should only implement these functions, it is the tester that will be calling and testing each one of them. Last, be reminded that the generic structure of a function is the following: def function_name(arg1, arg2, etc.) # this line is the signature # commands go here # more commands # result = ... return result # this line returns the result of your computations The following are the functions you must implement: blood pressure(systolic, diastolic) Description: Blood pressure is measured using two numbers. The first number, called systolic blood pressure, measures the pressure in your blood vessels when your heart beats. The second number, called diastolic blood pressure, measures the pressure in your blood vessels when your heart rests between beats. The American Heart Association categorizes the blood pressure according to the following chart (verbatim copy from the official site): Blood Pressure Category Normal Systolic less than 120 Diastolic less than 80 AND 1 ano n Elevated Hypertension Stage 1 Hypertension Stage 2 Hypertensive Crisis 120 - 129 130 - 139 140 or higher higher than 180 AND OR OR AND/OR less than 80 80 - 89 90 or higher higher than 120 Assume that normal corresponds to risk level 1.0, elevated corresponds to risk level 1.1, and so forth (the max is hypertensive crisis which corresponds to risk level 1.4). In case a measurement can be classified in more than one categories, we assign it to the one with the highest risk. Calculate this risk level as well as the mean arterial pressure, defined as: systolic + 2 diastolic meanpressure = 3 Parameters: systolic (int) is the systolic blood pressure, diastolic (int) is the diastolic blood pressure Return value: The function returns the product of risk level times the mean arterial pressure as a float rounded to 2 decimals (hint: there is a Python built-in function for rounding) Examples: blood pressure(106, 75) blood pressure(148, 90) 85.33 142.13 standard_BMI(weight, height, ISU) Description: The body mass index BMI is defined as the body mass divided by the square of the body height, and is universally expressed in units of kg/m2, resulting from mass in kilograms and height in meters. This function calculates the BMI value given three parameters. Parameters: weight (int) is the body mass of the person, height (float) is the height of the person, and ISU (boolean) is a flag to indicate whether the weight and height are given in the International System of Units or not. If ISU is True then weight is in kilos and height is in meters, otherwise weight is in ounces and height is in inches. If you need to convert the parameters use the following simplified formulas: 1 kilo = 35 ounces, 1 inch = 0.025 meters Return value: The calculated value of BMI as a float expressed in kg/m2 rounded to 2 decimals Examples: standard_BMI(75, 1.76, True) standard_BMI(3500, 79, False) 24.21 25.64 BMI_chart(weight, height, age, gender) Description: The BMI is a convenient rule of thumb used to broadly categorize a person as underweight, normal weight, overweight, or obese based on some charts. The following is the chart for adults (greater or equal to 18 years): BMI category underweight below 18.5 from 18.5 (included) to 25 (included) from 25 (excluded) to 30 (included) higher than 30 normal weight overweight obese And the following is the chart for male children: BMI below 14 from 14 (included) to 19 (included) from 19 (excluded) to 22 (included) higher than 22 category underweight normal weight overweight obese In case of female children the above chart values are increased by 1 BMI unit, i.e. 14 becomes 15, 19 becomes 20, and 22 becomes 23. Please keep in mind that this function does not calculate the body mass index itself but is calling the standard_BMI function you have implemented before. Parameters weight (int) in kilograms, height (float) in meters, age (int) is age in whole years, gender (string) is either 'male' or 'female' Return value: It returns a string containing one of the four possible values: 'underweight', 'normal', 'overweight', 'obese'. Make sure you have no typos otherwise the tester will fail. Examples: BMI_chart(75, 1.76, 43, 'female') 'normal' HCT(red_cells, total_cells, age, gender) Description: The hematocrit (HCT) is a blood test that measures the volume percentage (vol%) of the red cells in blood. For adults, it is normally 40.7% to 50.3% for men and 36.1% to 44.3% for women. For children (below 18 years), the normal range is 36% to 40% regardless of gender. All values are inclusive. Parameters: red_cells (int) is the number of red cells in the blood, total_cells (int) is the total number of cells in the blood, age (int) is age in whole years, gender (string) is either 'male' or 'female'. Return value: The function returns True if the HCT is normal and False otherwise. It also returns False if the total number of cells is less than 1 million because the result in that case is inconclusive. Examples: HCT(206567899, 454677789, 18, 'male') HCT(194005321,594677789, 67, 'female') True False LDL(total, HDL, trig, age, gender) Description: Higher levels of LDL (low-density lipoprotein) increase the risk of cardiovascular disease. LDL is calculated with the Friedewald equation: LDL = total cholesterol HDL cholesterol - k. triglycerides where kis usually 0.2. If triglycerides concentration is not between 11.3 and 43.5 (values inclusive), the result is inaccurate and therefore we discard the last term fiel-0) However if both total cholesterol and LDL(total, HDL, trig, age, gender) Description: Higher levels of LDL (low-density lipoprotein) increase the risk of cardiovascular disease. LDL is calculated with the Friedewald equation: LDL = totalcholesterol - HDL cholesterol - k. triglycerides where k is usually 0.2. If triglycerides concentration is not between 11.3 and 43.5 (values inclusive), the result is inaccurate and therefore we discard the last term (i.e. k=0). However, if both total cholesterol and triglycerides levels are elevated (i.e. greater than 250 and 43.5 respectively) then we use a modified version of the Friedewald equation where khas an initial value of 0.19 and is reduced by 0.01 for each whole 10 units of increase of total above 250, e.g. if total is 251-259 then k is 0.19, if total is 260-269 then k is 0.18, and so forth. Note: Hard coding is not allowed, your code must work with any value of total Parameters: total (int) is the total cholesterol, HDL (int) is the "good" cholesterol, trig (float) is the number of triglycerides, age (int) is age in whole years, gender (string) is either 'male' or 'female' Return value: The function returns an integer value between 0 and 5 that indicates the level of risk (5 is the highest) based on the following rules: Adults: if LDL is less than 120 then risk is 0. Otherwise, the level of risk starts at 1, maxes out at 5, and is increased by 1 for each whole 20 units of LDL, i.e. from 120 (inclusive) to 140 (exclusive) risk is 1, from 140 (inclusive) to 160 (exclusive) risk is 2, and so forth. Children (less than 18 years): if LDL less than 100 then risk is 0. Otherwise, the level of risk starts at 1, maxes out at 5, and is increased by 1 for each whole 15 units of LDL. Adults: if HDL is less than 40 for men or less than 50 for women, the level of risk that is calculated Ollglycerides, age (int) is age in whole years, gender (suring) is eller mal Return value: The function returns an integer value between 0 and 5 that indicates the level of risk (5 is the highest) based on the following rules: Adults: if LDL is less than 120 then risk is 0. Otherwise, the level of risk starts at 1, maxes out at 5, and is increased by 1 for each whole 20 units of LDL, i.e. from 120 (inclusive) to 140 (exclusive) risk is 1, from 140 (inclusive) to 160 (exclusive) risk is 2, and so forth. Children (less than 18 years): if LDL is less than 100 then risk is 0. Otherwise, the level of risk starts at 1, maxes out at 5, and is increased by 1 for each whole 15 units of LDL. Adults: if HDL is less than 40 for men or less than 50 for women, the level of risk that is calculated based on LDL is increased by 1. To the contrary, if HDL is more than 70 regardless of gender, the level of risk that is calculated based on LDL is reduced by 1. Examples: LDL(257, 50, 44.1, 67, 'female') LDL(174, 62, 34.8, 23, 'male') 4 0 5
Step by Step Solution
There are 3 Steps involved in it

Get step-by-step solutions from verified subject matter experts