

Question: Functions (Plot) The aim is to fill two vector arrays xv and yv with x and f(x) values, respectively, where the probability density function for
Functions (Plot) The aim is to fill two vector arrays xv and yv with x and f(x) values, respectively, where the probability density function for Pareto is: (,)=+1 f ( x , b ) = b x b + 1 for >1 x > 1 and >0 b > 0 . Pareto takes b as a shape parameter for b . Let the x v values be uniformly spaced in =[1,5] x v = [ 1 , 5 ] with 100 grid points. Write a loop to fill in the values for x v and =(,) y v = f ( x v , b ) , for =1 b = 1 , =2 b = 2 and =3 b = 3 . So at the end you should have a vector x v with the X-values and a vector y v with the function values (,) f ( x , b ) for any given b . Plot y v against x v using the plot command (you should have three lines in a single figure - one for each b ).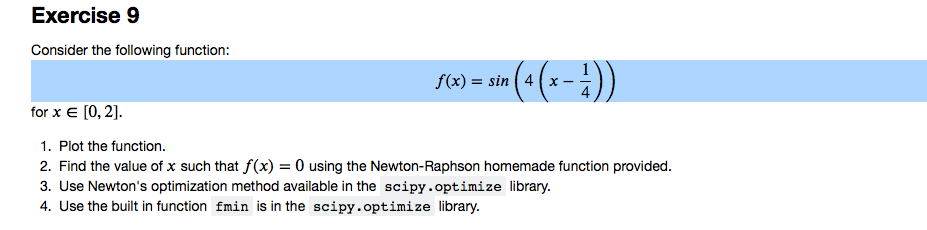
Exercise 9 (4(x-1)). Consider the following function: f(x) = sin( 4 for x (0,2). 1. Plot the function. 2. Find the value of x such that f(x) = 0 using the Newton-Raphson homemade function provided. 3. Use Newton's optimization method available in the scipy.optimize library. 4. Use the built in function fmin is in the scipy.optimize library. Exercise 9 (4(x-1)). Consider the following function: f(x) = sin( 4 for x (0,2). 1. Plot the function. 2. Find the value of x such that f(x) = 0 using the Newton-Raphson homemade function provided. 3. Use Newton's optimization method available in the scipy.optimize library. 4. Use the built in function fmin is in the scipy.optimize library
Step by Step Solution
There are 3 Steps involved in it

Get step-by-step solutions from verified subject matter experts