

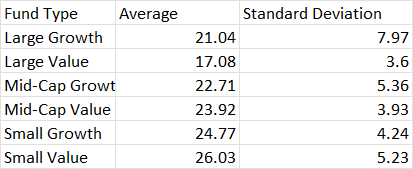
Question: Fund Type Average Standard DeviationLarge Growth 21.04 7.97Large Value 17.08 3.6Mid-Cap Growth 22.71 5.36Mid-Cap Value 23.92 3.93Small Growth 24.77 4.24Small Value 26.03 5.23Using excel please
Fund Type Average Standard DeviationLarge Growth 21.04 7.97Large Value 17.08 3.6Mid-Cap Growth 22.71 5.36Mid-Cap Value 23.92 3.93Small Growth 24.77 4.24Small Value 26.03 5.23Using excel please create a clustered bar chart with average returns and standard deviations being represented by two different color bars. On the horizontal axis please include each fund type (similar to where you see the months in the below graph). If your bars are hard to interpret, please include a dual axis as seen in the below picture. Then, after constructing the graph infer what the output of the graph means in the relationship between standard deviation and average returns. Are the two related? If so, what kind of relationship exists between them?
Step by Step Solution
There are 3 Steps involved in it

Get step-by-step solutions from verified subject matter experts