

Question: Further Exercises Q4). A sampling distribution is shown for the proportion of US citizens over 15 years old who have never been married, using the
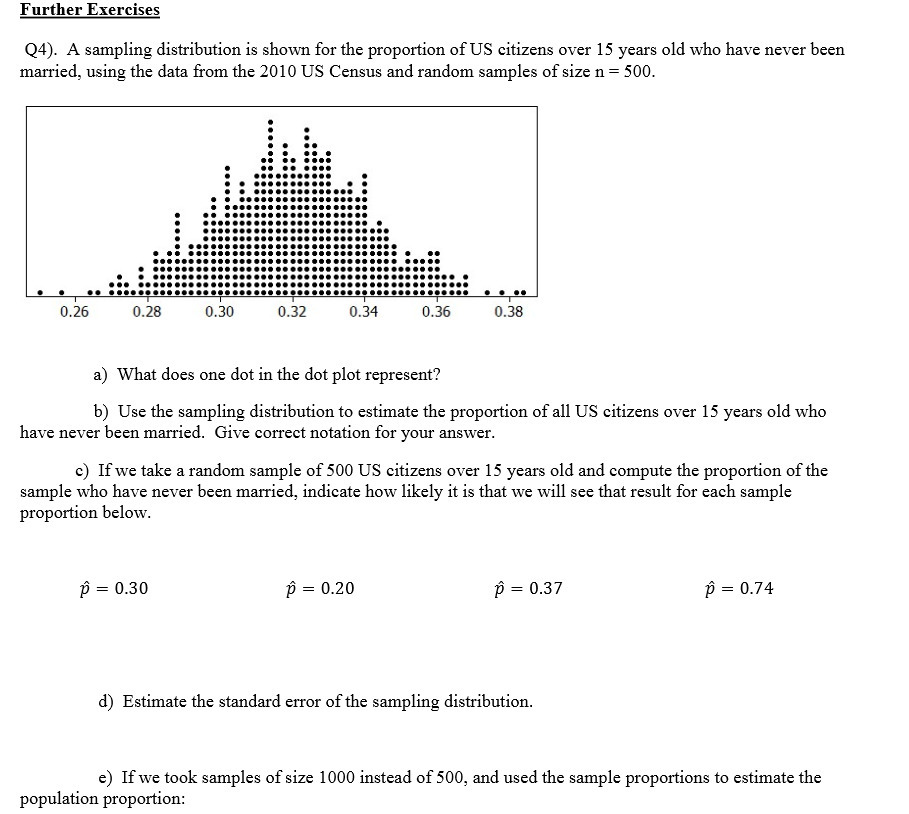
Further Exercises Q4). A sampling distribution is shown for the proportion of US citizens over 15 years old who have never been married, using the data from the 2010 US Census and random samples of size n = 500. 0.26 0.28 0.30 0.32 0.34 0.36 0.38 a) What does one dot in the dot plot represent? b) Use the sampling distribution to estimate the proportion of all US citizens over 15 years old who have never been married. Give correct notation for your answer. c) If we take a random sample of 500 US citizens over 15 years old and compute the proportion of the sample who have never been married, indicate how likely it is that we will see that result for each sample proportion below. p = 0.30 p = 0.20 p = 0.37 p = 0.74 d) Estimate the standard error of the sampling distribution. ) If we took samples of size 1000 instead of 500, and used the sample proportions to estimate the population proportion
Step by Step Solution
There are 3 Steps involved in it

Get step-by-step solutions from verified subject matter experts