

Question: Further to your discussion in task 1, you will complete the below practical to highlight the effects of implementing a quality control tool. ElecWare manufacture
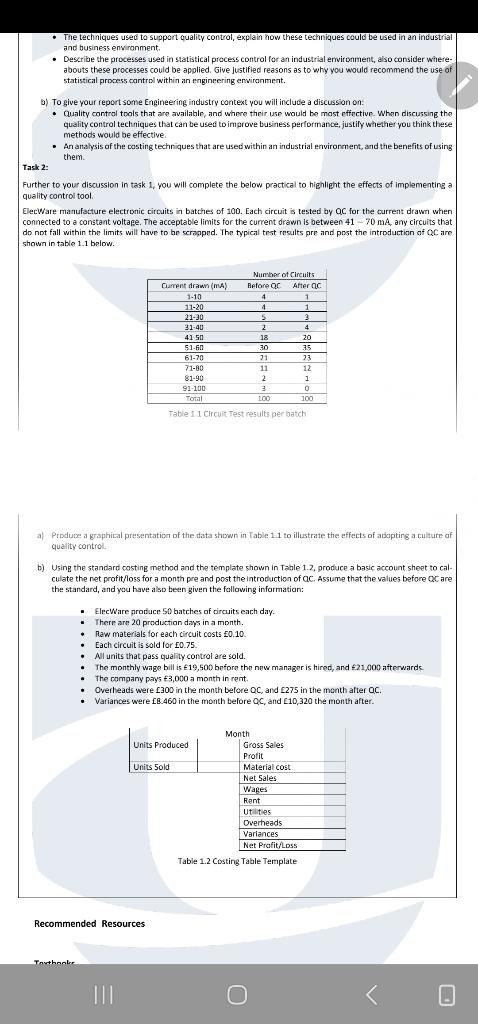 Further to your discussion in task 1, you will complete the below practical to highlight the effects of implementing a quality control tool. ElecWare manufacture electronic circuits in batches of 100. Each circuit is tested by QC for the current drawn when connected to a constant voltage. The acceptable limits for the current drawn is between 41 70 mA, any circuits that do not fall within the limits will have to be scrapped. The typical test results pre and post the introduction of QC are shown in table 1.1 below.
- The techniques used to support quality control, explain how these techniques could be used in an infustrial and business enviranment. - Describe the processes used in statistical process control for an industrial erivironment, also consider whereabouts these processes could be applied. Give justified reasons as to why you would recommend the use of statistical process cantrol within an engineering erwironment. b) To give your report same Engineering industry context you will include a discussion on: - Quality control trols that are available, and where their use would be most effiective. When discussing the quality control techniques that can be used to improve business performance, justily whether you think these methods would be effective. - An analysis of the costing techniques that are used within an industrial environment, and the benefits of using them. Further to your discussion in task 1, you will complete the below practical to highlight the effects of implementing a quality controi tool. glecWare manufacture electronic circuits in batches of 100 . Each circuit is tested by QC for the current drawn when connected to a constant voltape. The acceptable limits for the current drawn is between 4170mA, any circuits that do not fill within the limits will have to be serapped. The typical test results pre and post the introduction of QC are shown in table 1.1 below. a) Produce a graphical presentatico of the data shewn in Table 11 to illustrate the effects of adopting a culture of quality control. b) Using the standard costing method and the template shown in Table 1.2, produce a basic account sheet to calculate the net profitfloss for a month pre and post the introduction of aC. Assume that the values before QC are the standard, and you have also been given the following information: - ElecWare prodiuce 50 batches of circuits each day. - There are 20 production days in a month. - Raw materials for each circuit costs \pm 0.10 - Each circuit is sold tor 0.75. - All units that pass cuality control are sold. - The monthly wage bill is 19,500 beforo the now manager is hired, and 21,000 afterwards. - The compary pays 43,000 a month in rent. - Overleads were f300 in the month before QC, and 2275 in the month after QC. - Variances were fBA60 in the month before QC, and [10,320 the month after. Recommended Resources
Step by Step Solution
There are 3 Steps involved in it

Get step-by-step solutions from verified subject matter experts