

Question: Future Value and Present Value Tables Table I Future Value of $1.00(1 Perlod 12% 20% 4% 6% 8% 10% 14% 1.100 1200 1 1.040 1.060
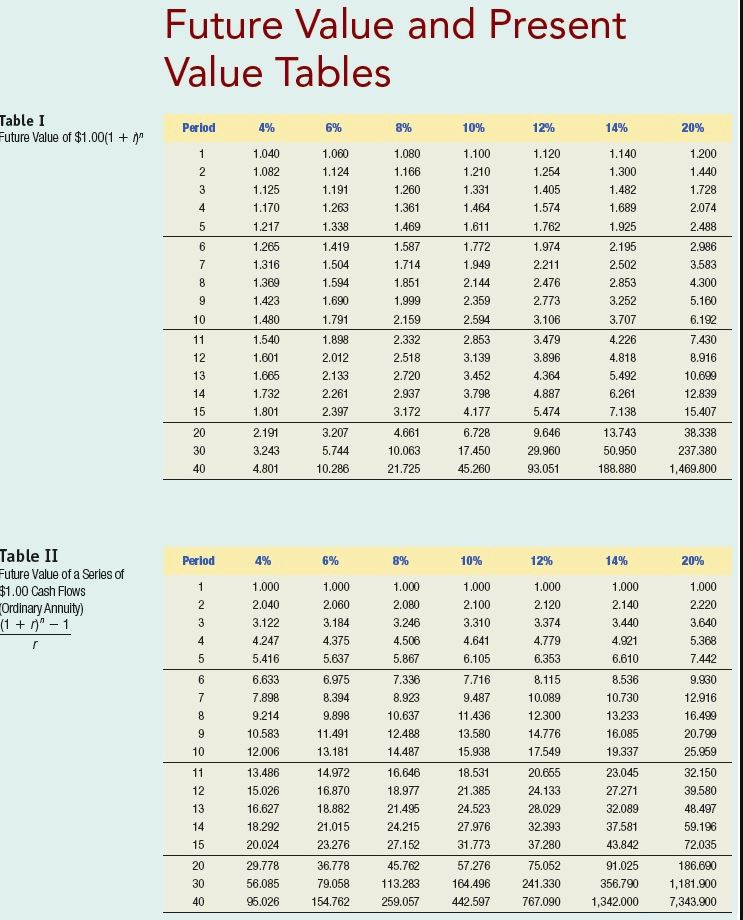
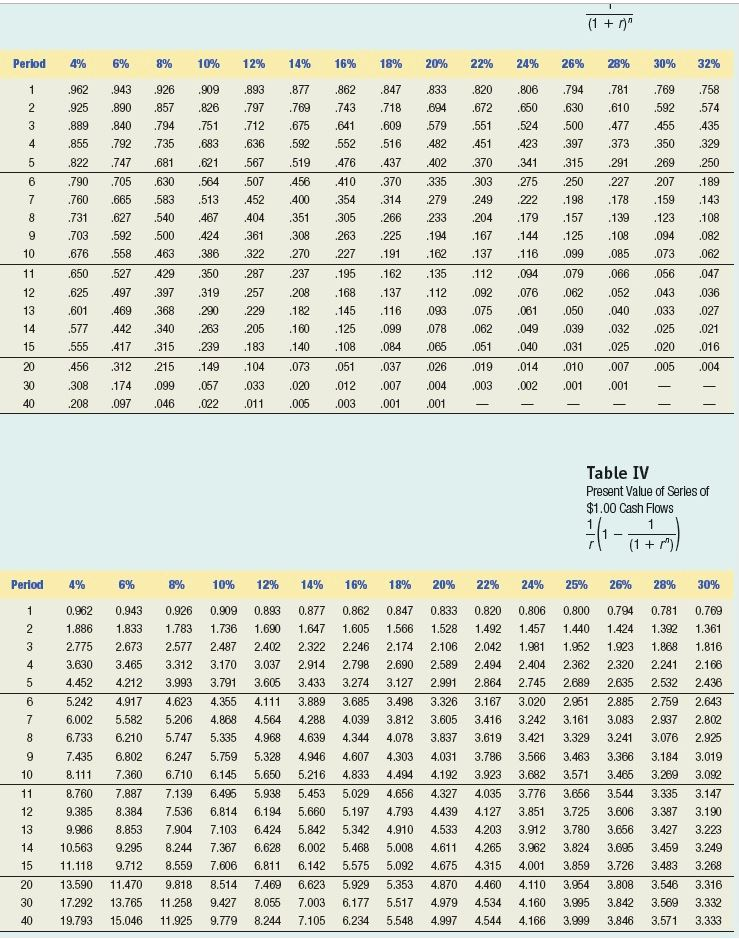
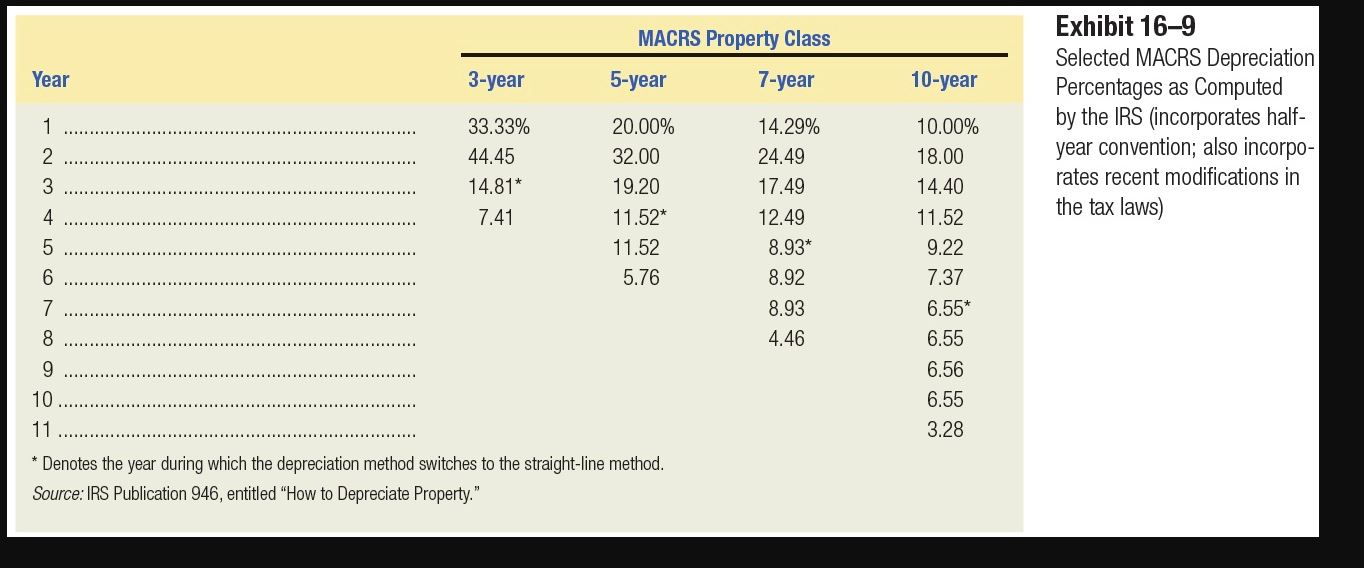
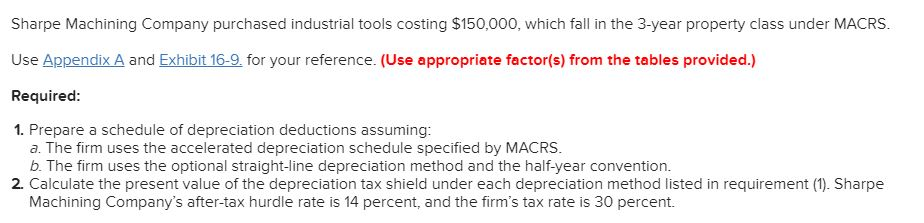
Future Value and Present Value Tables Table I Future Value of $1.00(1 Perlod 12% 20% 4% 6% 8% 10% 14% 1.100 1200 1 1.040 1.060 1.080 1.120 1.140 1.440 2 1.082 1.124 1.166 1.210 1.254 1.300 3 1.125 1.191 1.260 1.331 1.405 1.482 1.728 4 1.170 1.263 1.361 1.464 1.574 1.689 2.074 1.925 5 1.217 1.338 1.469 1.611 1.762 2.488 6 1.265 1.419 1.587 1.772 1.974 2.195 2.986 1.714 7 1.316 1.504 1.949 2.211 2.502 3.583 8 1.369 1.594 1.851 2.144 2.476 2.853 4.300 1.999 2.773 5.160 1.423 1.690 2.359 3.252 2.594 6.192 10 1.480 1.791 2.159 3.106 3.707 11 1.540 1.898 2.332 2.853 3.479 4.226 7.430 3.896 8.916 12 1.601 2.012 2.518 3.139 4.818 4.364 13 1.665 2.133 2.720 3.452 5.492 10.699 14 1.732 2.261 2.937 3.798 4.887 6.261 12.839 15 1.801 2.397 3.172 4.177 5.474 7.138 15.407 20 2.191 3.207 4.661 6.728 9.646 13.743 38.338 237.380 30 3.243 5,744 10.063 17.450 29.960 50.950 1,469.800 40 4.801 10.286 21.725 45.260 93.051 188.880 Table II Period 4% 6% 8% 10% 12% 14% 20% Future Value of a Series of 1 1.000 1.000 1.000 1.000 1.000 1.000 1.000 $1.00 Cash Flows Ordinary Annulty) (1n 1 2 2.040 2.060 2.080 2.100 2.120 2.140 2.220 3 3.122 3.184 3.246 3.310 3.374 3.440 3.640 4.247 4 4.375 4.506 4.641 4.779 4.921 5.368 5 5.416 5.637 5.867 6.105 6.353 6.610 7.442 7.336 6 6.633 6.975 7.716 8.115 8.536 9.930 10.089 7 7,898 8.394 8.923 9.487 10.730 12.916 9.214 9.898 10.637 11.436 12.300 13.233 16.499 10.583 11.491 12.488 13.580 14.776 16.085 20.799 25.959 10 12.006 13.181 14.487 15.938 17.549 19.337 11 13.486 14.972 16.646 18.531 20.655 23.045 32.150 18.977 21.385 12 15.026 16.870 24.133 27271 39.580 13 16.627 18.882 21.495 24.523 28.029 32.089 48.497 14 18.292 21.015 24.215 27.976 32.393 37.581 59.196 27.152 15 20.024 23.276 31.773 37.280 43.842 72.035 20 29.778 36.778 45.762 57.276 75.052 91.025 186.690 1,181.900 30 56.085 79,058 113.283 164.496 241.330 356.790 767.090 7,343.900 40 95.026 154.762 259.057 442.597 1,342.000 $96 (1 28% 12% 16% Perlod 4% 6% 8% 10% 14% 18% 20% 22% 24% 26% 30% 32% 833 820 1 .962 943 926 .909 893 877 .862 847 .806 794 781 769 758 610 2 925 890 857 826 797 769 743 718 694 672 650 .630 592 574 3 889 840 794 751 712 675 641 .609 579 551 524 500 477 455 435 4. 855 792 735 .683 .636 .592 .552 516 482 451 423 397 373 350 329 .519 5 822 747 .681 .621 .567 .476 .437 402 370 341 315 291 269 250 6 790 705 .630 .564 .507 456 410 370 335 303 275 250 227 207 189 760 7 .665 583 .513 452 400 354 314 279 249 222 198 .178 .159 143 8 731 .627 540 467 404 351 305 266 233 204 .179 .157 139 123 108 .167 082 703 .592 .500 424 361 308 263 .225 194 .144 .125 108 094 10 .676 558 463 386 322 .270 227 .191 .162 137 116 099 .085 073 062 11 .650 527 429 350 287 237 .195 .162 .135 112 .094 079 066 056 .047 12 .625 497 397 319 257 208 .168 .137 112 092 .076 .062 052 .043 .036 145 13 .601 469 368 290 229 .182 116 093 075 061 .050 .040 033 027 078 14 577 442 340 263 205 .160 125 .099 .062 .049 .039 .032 025 .021 15 555 417 315 239 183 140 108 084 065 051 040 031 025 020 016 073 037 .007 20 456 312 215 149 104 051 026 019 .014 010 005 004 30 308 174 099 057 .033 .020 .012 .007 004 003 .002 001 001 40 208 097 .046 .022 .011 .005 003 .001 001 Table IV Present Value of Series of $1.00 Cash Flows (1r) 12% Period 4% 6% 8% 10% 14% 16% 18% 20% 22% 24% 25% 26% 28% 30% 0.820 0.962 0.943 0.926 0.909 0.893 0.877 0.862 0.847 0.833 0.806 0.800 0.794 0.781 0.769 2 1.886 1.833 1.783 1.736 1.690 1.647 1.605 1.566 1.528 1.492 1.457 1.440 1.424 1.392 1.361 2.246 3 2.775 2.673 2.577 2.487 2.402 2.322 2.174 2.106 2.042 1.981 1.952 1.923 1.868 1.816 3.630 3.465 2.798 2.362 4 3.312 3.170 3.037 2.914 2.690 2.589 2.494 2.404 2.320 2.241 2.166 4.452 4.212 3.993 3.791 3.605 3.433 3.274 3.127 2.991 2.864 2.745 2.689 2.635 2.532 2.436 4.355 3.326 2.885 2.759 6 5.242 4.917 4.623 4.111 3.889 3.685 3.498 3.167 3.020 2.951 2.643 4.564 7 6.002 5.582 5.206 4.868 4.288 4.039 3.812 3.605 3.416 3.242 3.161 3.083 2.937 2.802 5.747 4.968 4.344 4.078 3.329 3.076 8 6.733 6.210 5.335 4.639 3.837 3.619 3.421 3.241 2.925 5.759 5.328 4.607 7.435 6.802 6.247 4.946 4.303 4.031 3.786 3.566 3.463 3.366 3.184 3.019 3.571 10 8.111 7.360 6.710 6.145 5.650 5.216 4.833 4.494 4.192 3.923 3.682 3.465 3.269 3.092 4.656 3.656 11 8.760 7.887 7.139 6.495 5.938 5.453 5.029 4.327 4.035 3.776 3.544 3.335 3.147 7.536 12 9.385 8.384 6.814 6.194 5.660 5.197 4.793 4.439 4.127 3.851 3.725 3.606 3.387 3.190 7.904 5.842 4.910 3.912 3.427 13 9.986 8.853 7.103 6.424 5.342 4.533 4.203 3.780 3.656 3.223 14 10.563 9.295 8.244 7.367 6.628 6.002 5.468 5.008 4.611 4.265 3.962 3.824 3.695 3.459 3.249 11.118 9.712 8.559 4.315 4.001 15 7.606 6.811 6.142 5.575 5.092 4.675 3.859 3.726 3.483 3.268 20 13.590 11.470 9.818 8.514 7.469 6.623 5.929 5.353 4.870 4.460 4.110 3.954 3.808 3.546 3.316 13.765 7,003 5,517 3.995 3.842 3.569 3.332 30 17.292 11.258 9.427 8.055 6.177 4.979 4.534 4.160 7.105 40 19.793 15.046 11.925 9.779 8.244 6.234 5.548 4.997 4.544 4.166 3.999 3.846 3.571 3.333 Exhibit 16-9 Selected MACRS Depreciation Percentages as Computed by the IRS (incorporates half- year convention; also incorpo- MACRS Property Class 7-year Year 3-year 5-year 10-year 20.00% 14.29% 33.33% 10.00% 18.00 44.45 32.00 24.49 rates recent modifications in 17.49 14.81* 19.20 14.40 the tax laws) 7.41 11.52* 12.49 11.52 8.93* 5 11.52 9.22 6 5.76 8.92 7.37 6.55* 7 8.93 8 4.46 6.55 9 6.56 10 6.55 11 3.28 Denotes the year during which the depreciation method switches to the straight-line method. Source: IRS Publication 946, entitled "How to Depreciate Property." N CO LO CO N Sharpe Machining Company purchased industrial tools costing $150,000, which fall in the 3-year property class under MACRS Use Appendix A and Exhibit 16-9. for your reference. (Use appropriate factor(s) from the tables provided.) Required: 1. Prepare a schedule of depreciation deductions assuming: a. The firm uses the accelerated depreciation schedule specified by MACRS. b. The firm uses the optional straight-line depreciation method and the half-year convention. 2. Calculate the present value of the depreciation tax shield under each depreciation method listed in requirement (1). Sharpe Machining Company's after-tax hurdle rate is 14 percent, and the firm's tax rate is 30 percent
Step by Step Solution
There are 3 Steps involved in it

Get step-by-step solutions from verified subject matter experts