

Question: g 1 Heading 2 Title Subtitle Subtle Em... Emphasis Intense E... Strong Quote Intense Q... Subtle Ref Styles Use the Empirical Rule to solve the

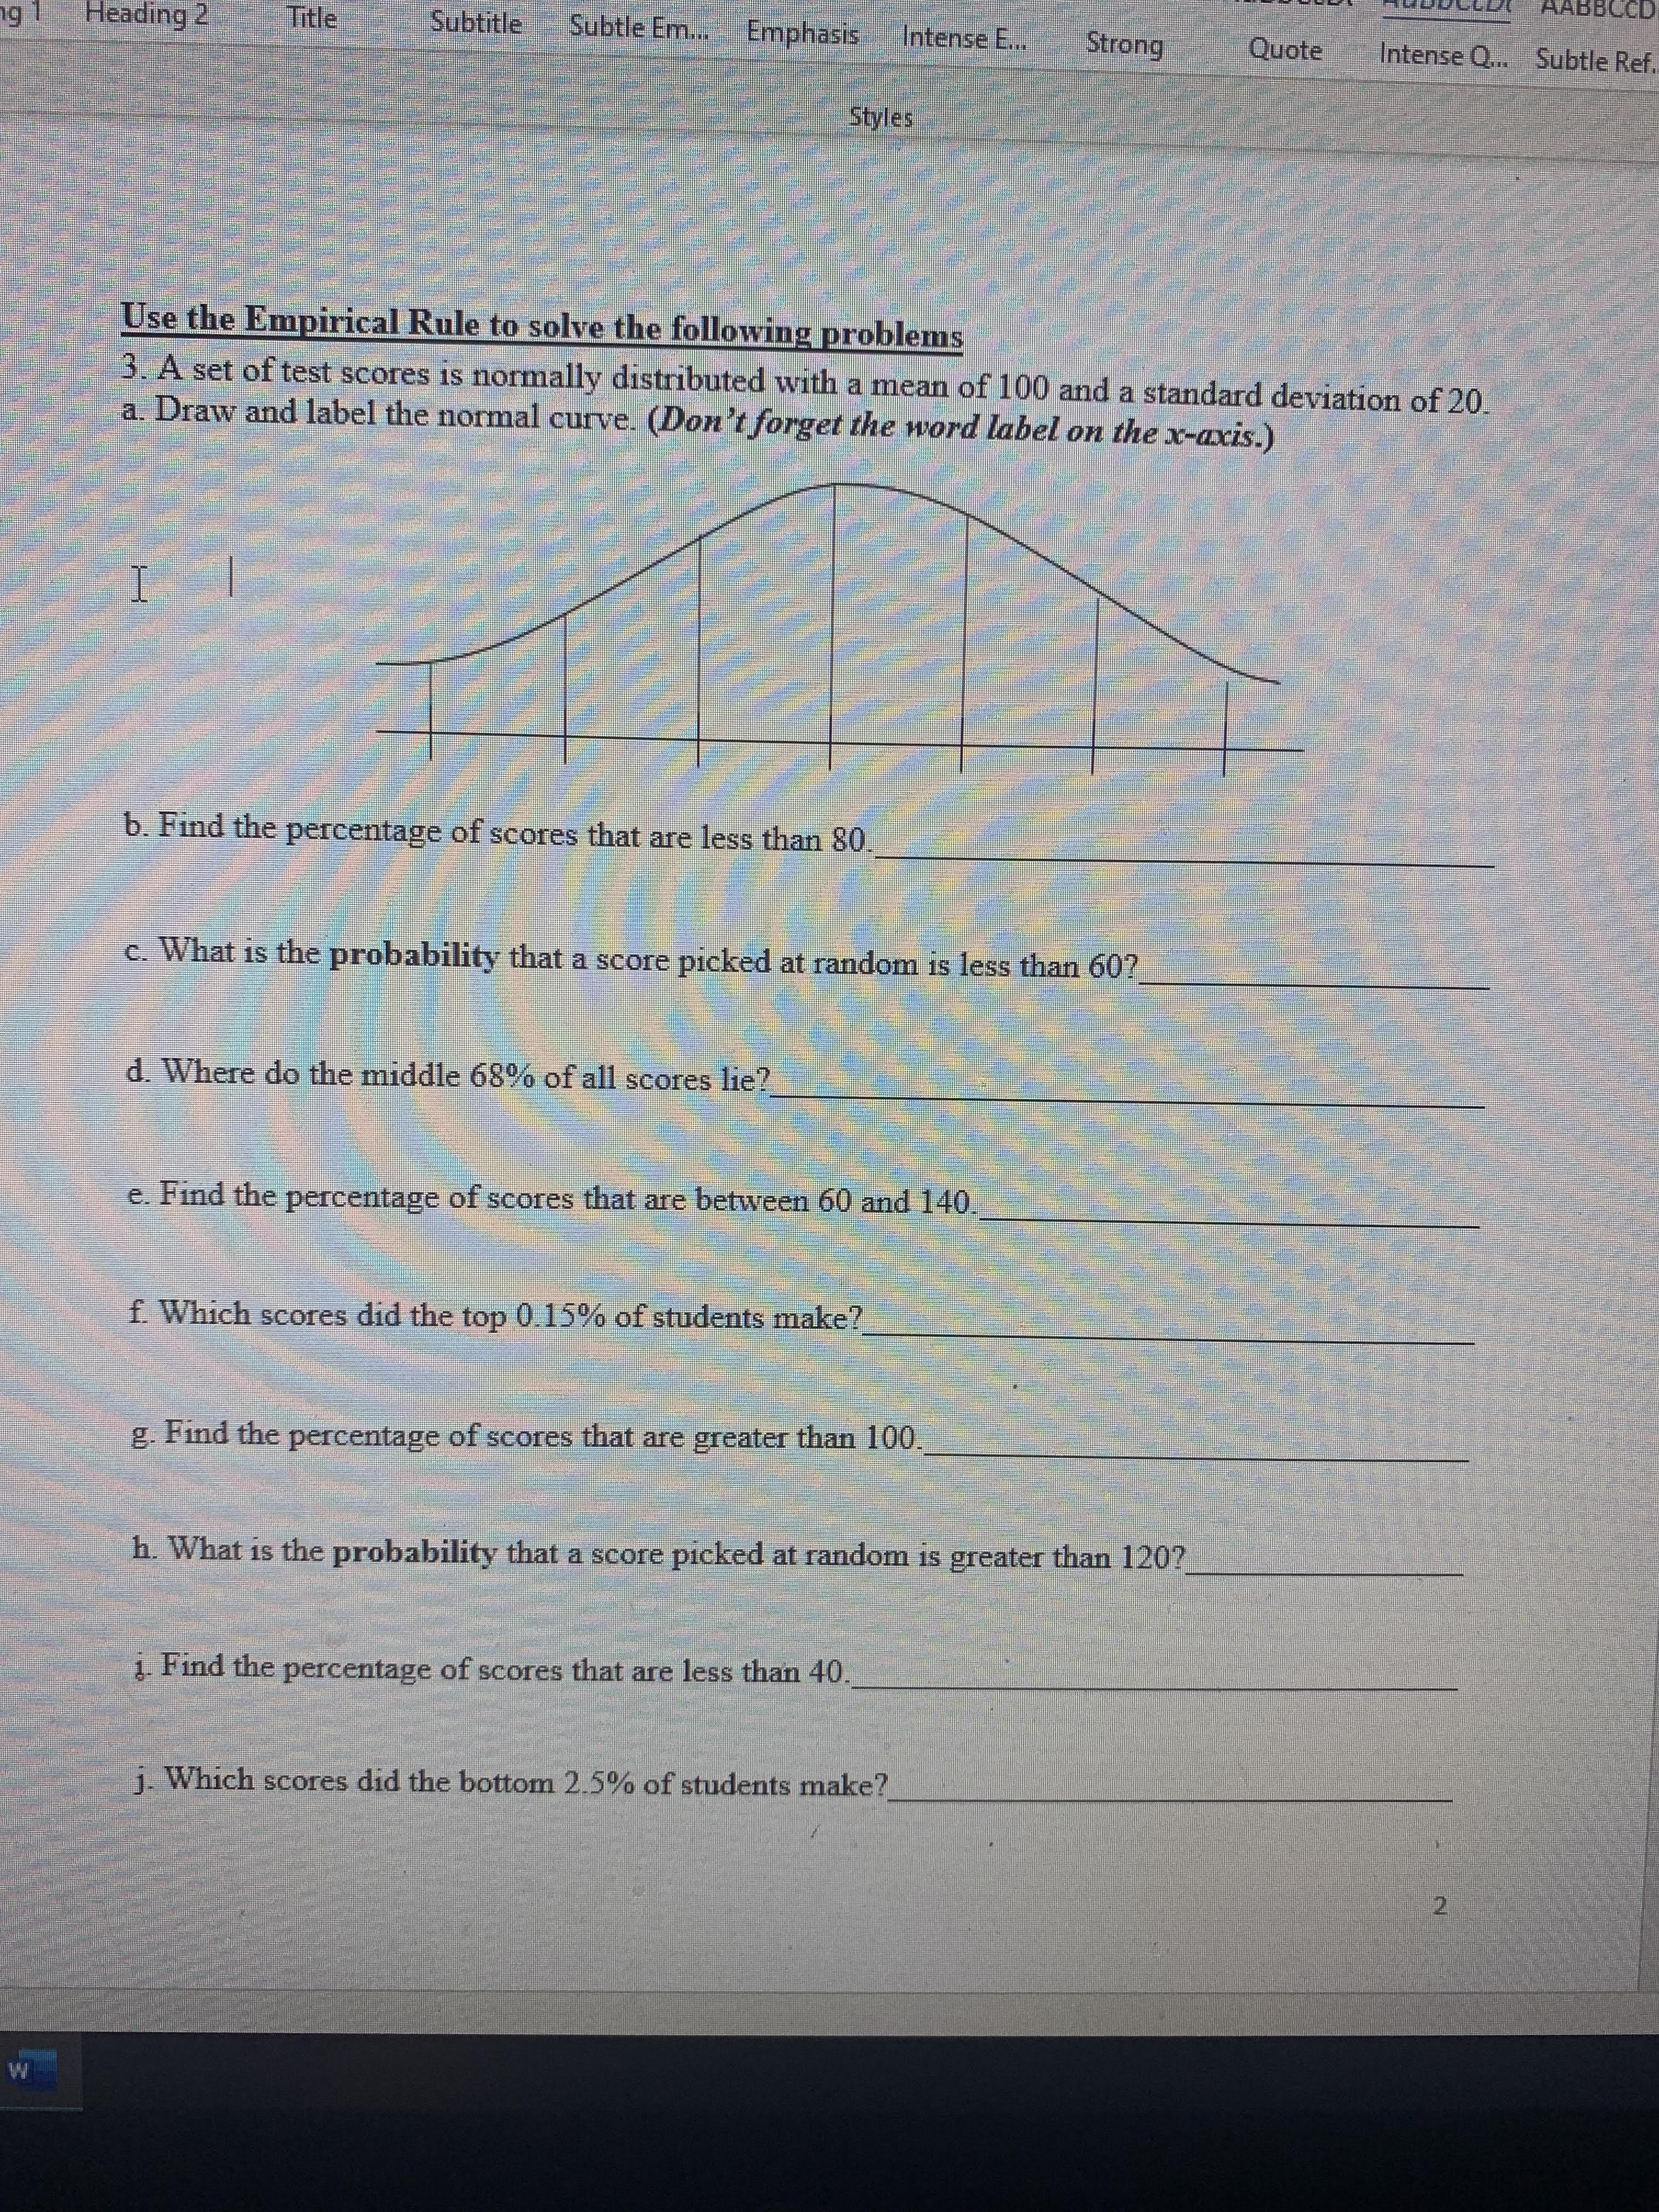
g 1 Heading 2 Title Subtitle Subtle Em... Emphasis Intense E... Strong Quote Intense Q... Subtle Ref Styles Use the Empirical Rule to solve the following problems 3. A set of test scores is normally distributed with a mean of 100 and a standard deviation of 20 a. Draw and label the normal curve. (Don't forget the word label on the x-axis.) b. Find the percentage of scores that are less than 80. c. What is the probability that a score picked at random is less than 60? d. Where do the middle 68% of all scores lie? e. Find the percentage of scores that are between 60 and 140. f. Which scores did the top 0.15% of students make? g. Find the percentage of scores that are greater than 100. h. What is the probability that a score picked at random is greater than 120? i. Find the percentage of scores that are less than 40. j. Which scores did the bottom 2.5% of students make? W
Step by Step Solution
There are 3 Steps involved in it

Get step-by-step solutions from verified subject matter experts