

Question: G) b) Plot a scatter chart for this data where index A is the independent variable. What does the scatter chart indicate about the relationship
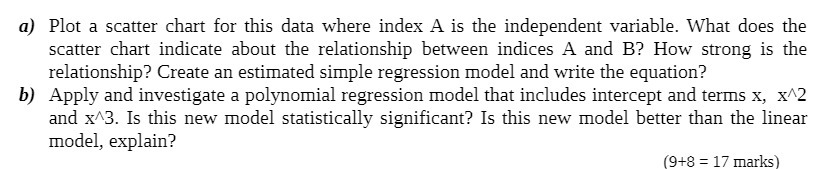
G) b) Plot a scatter chart for this data where index A is the independent variable. What does the scatter chart indicate about the relationship between indices A and B? How onng is the relationship? Create an estimated simple regression model and write the equation? Applyr and investigate a polynomial regression model that includes intercept and terms X, XAZ and KAS. Is this new model statistically signicant? Is this new model better than the linear model, explain? [9+8 = 1? marl-rs]
Step by Step Solution
There are 3 Steps involved in it
1 Expert Approved Answer
Step: 1 Unlock

Question Has Been Solved by an Expert!
Get step-by-step solutions from verified subject matter experts
Step: 2 Unlock
Step: 3 Unlock