

Question: g) Create a Spider Plot illustrating how the optimal profit changes as the availability of each of the four resources varies from 90 to 110
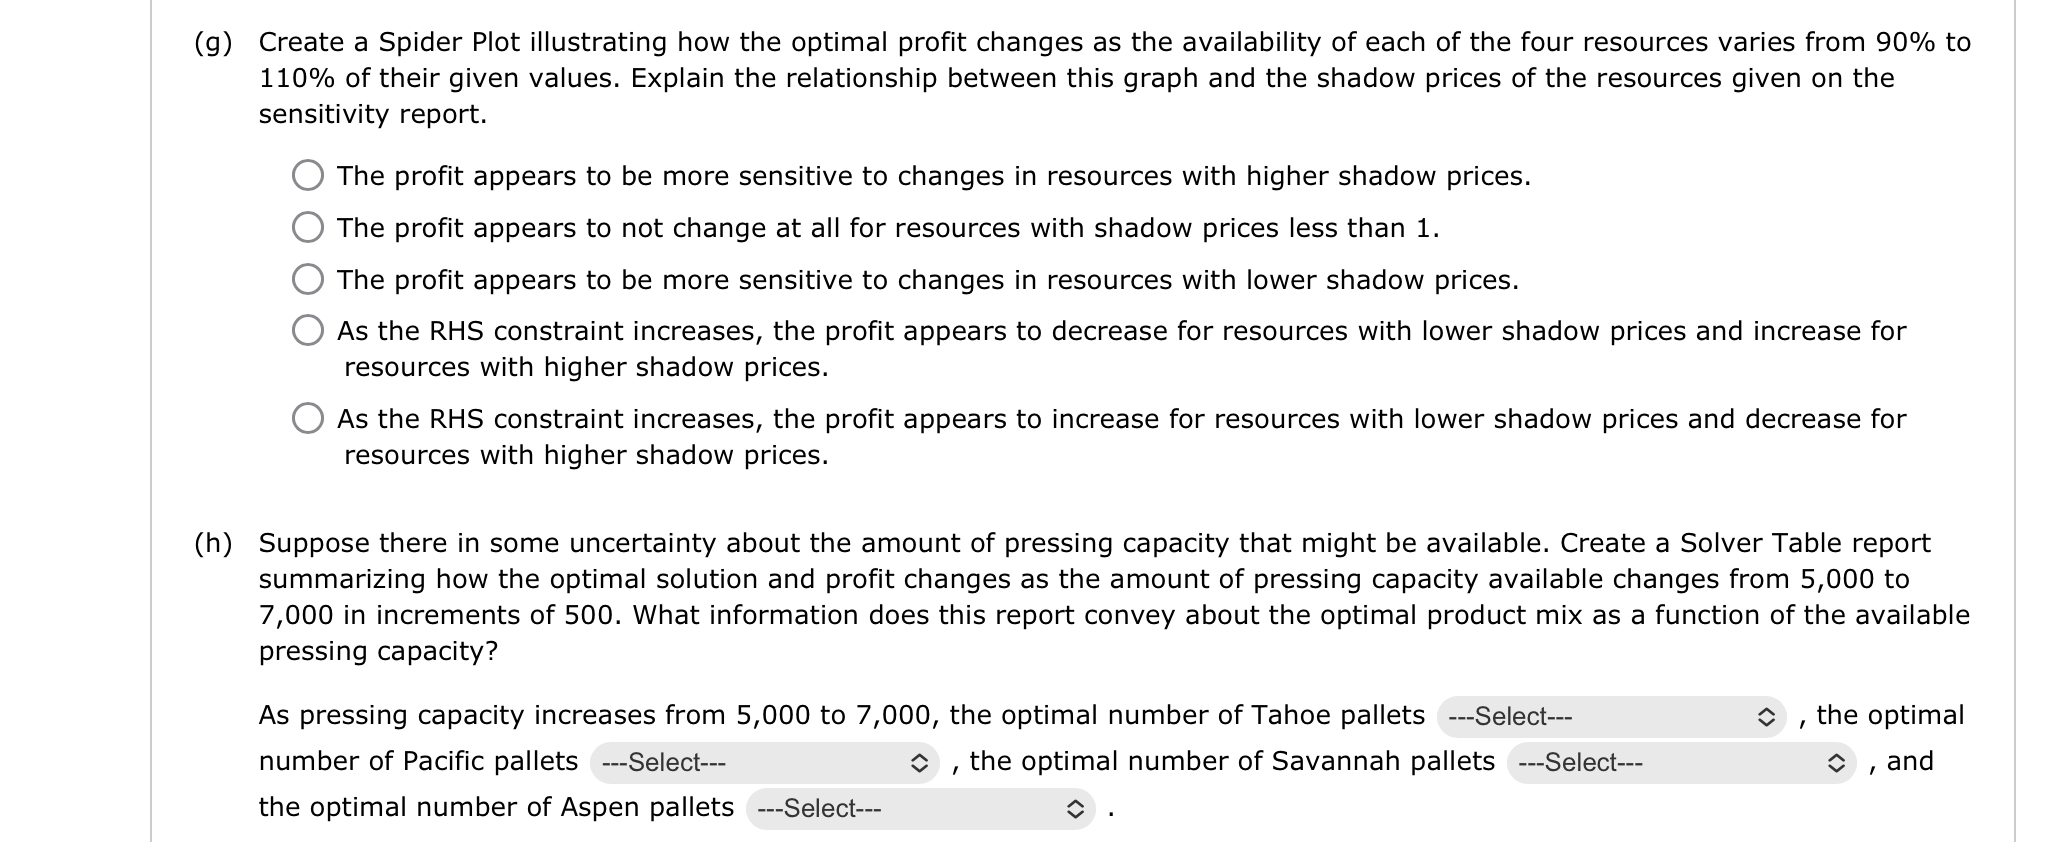
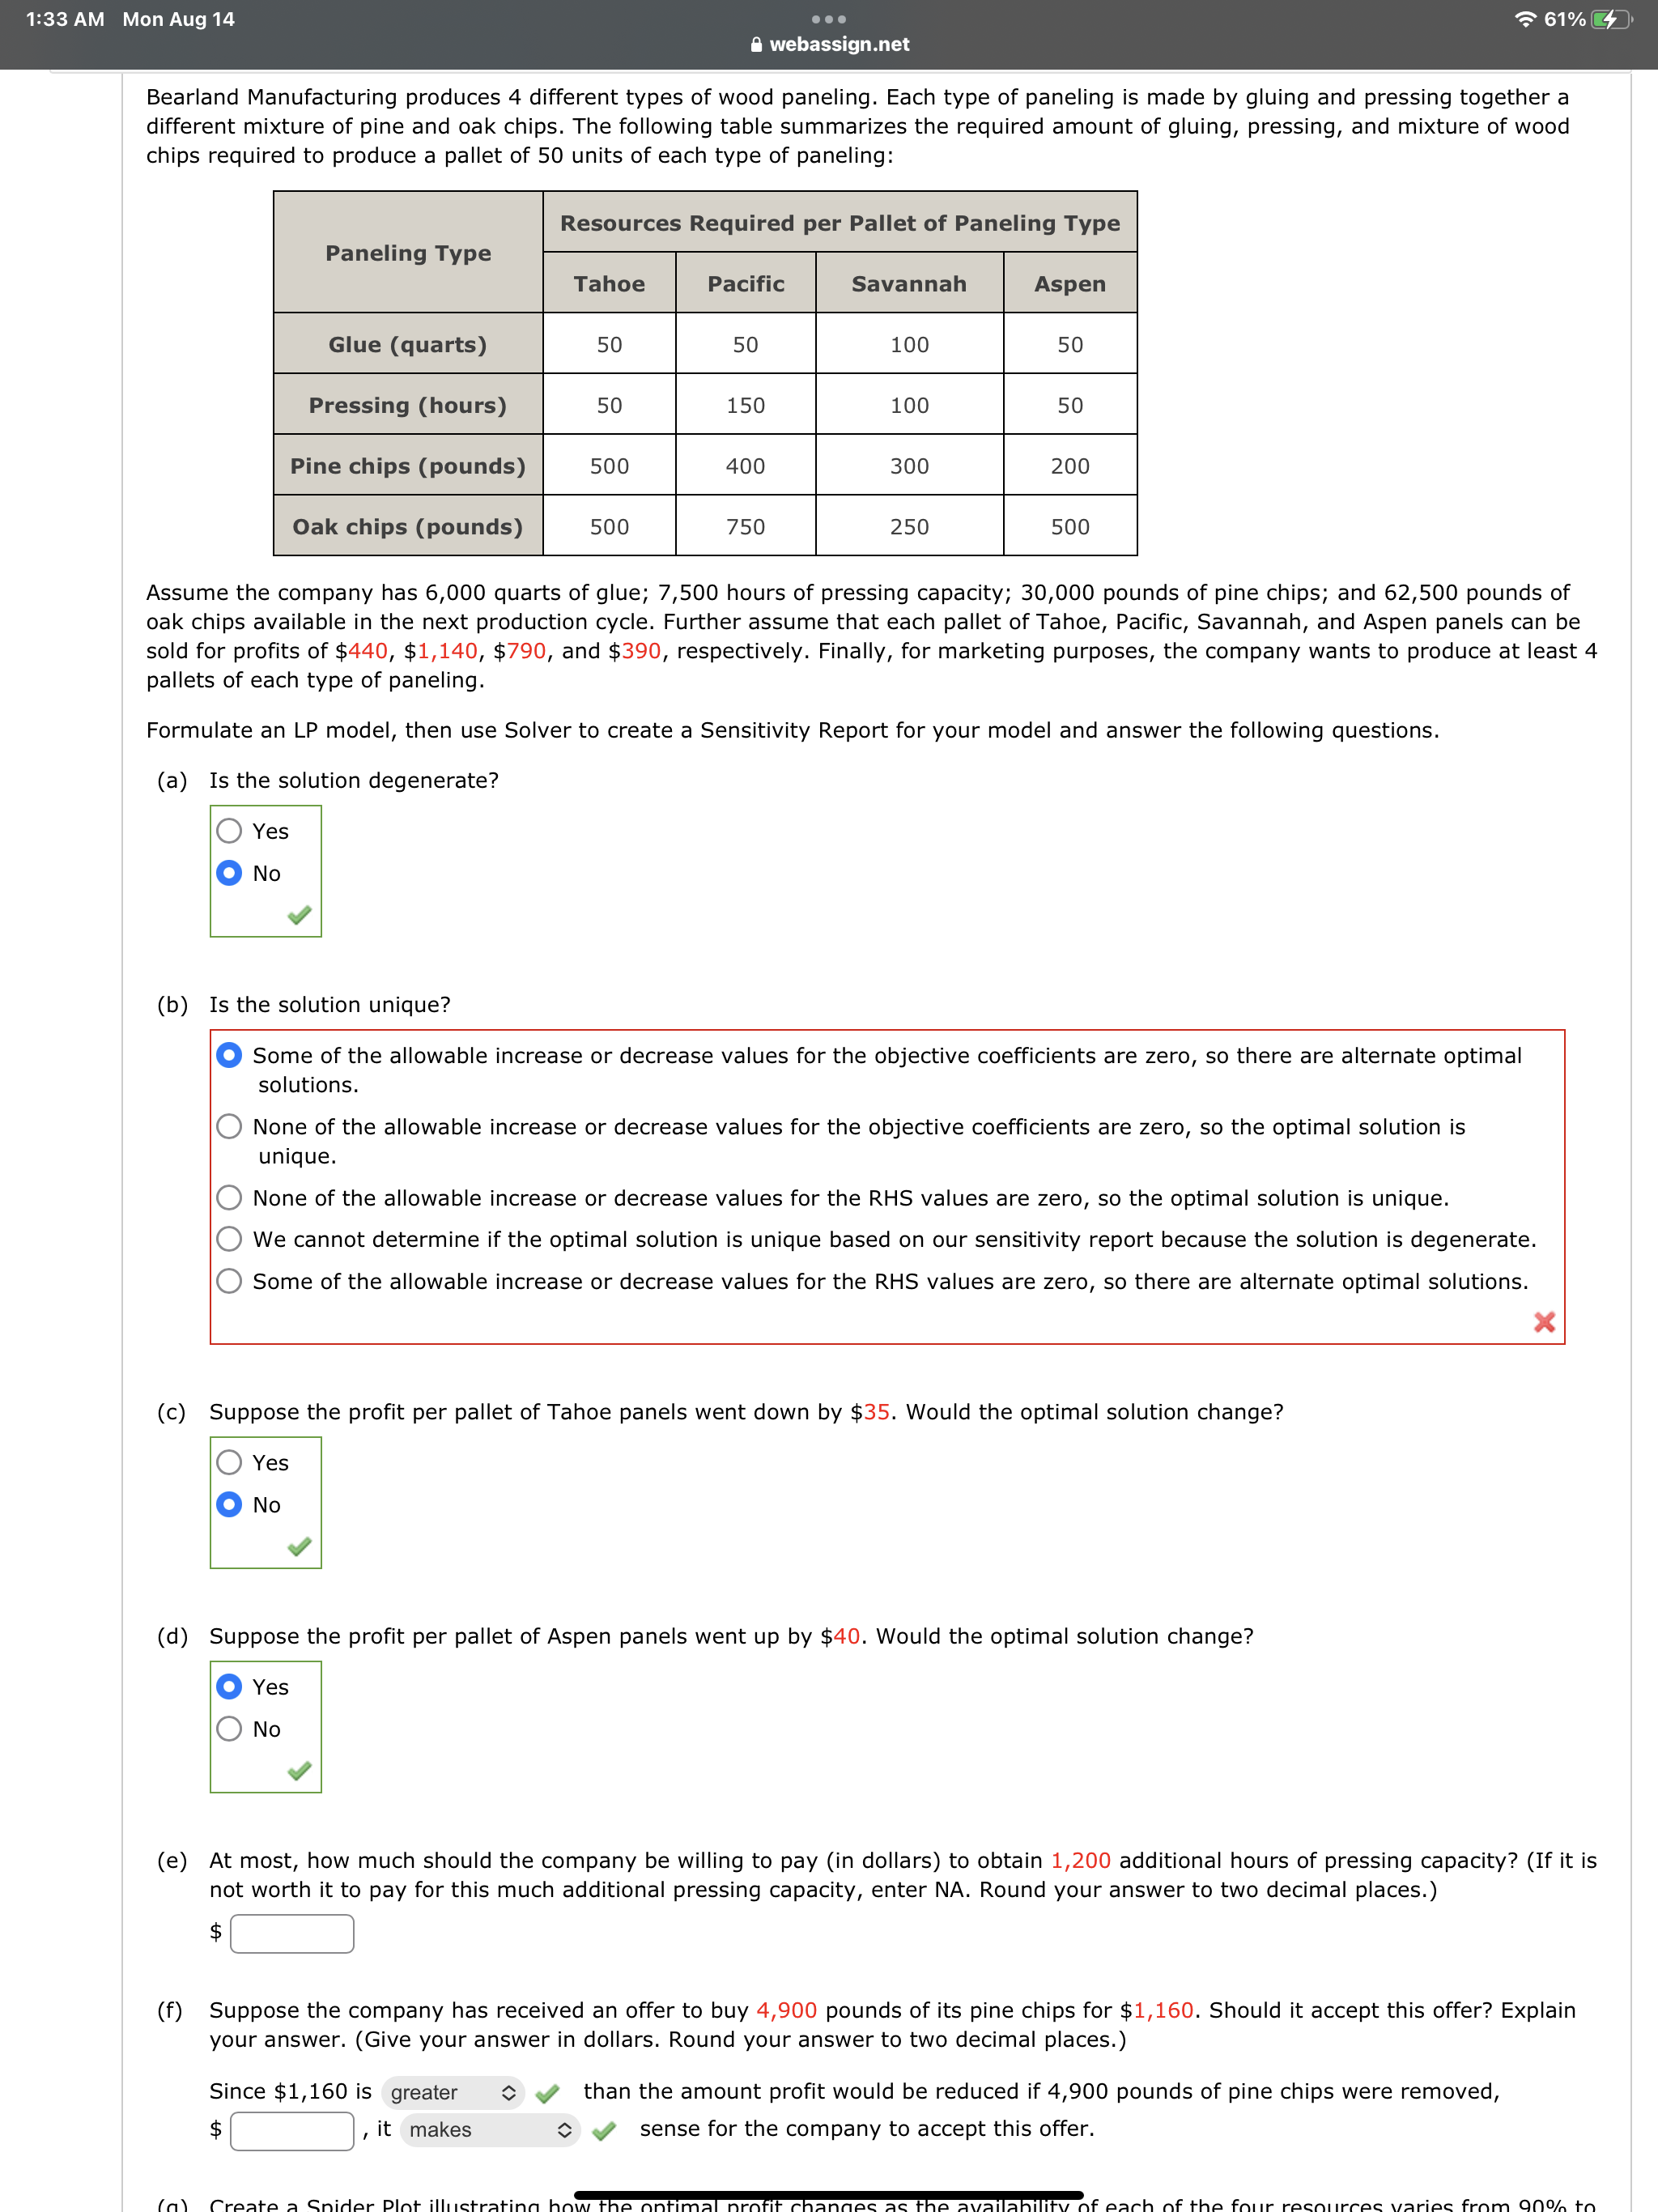
g) Create a Spider Plot illustrating how the optimal profit changes as the availability of each of the four resources varies from \90 to \110 of their given values. Explain the relationship between this graph and the shadow prices of the resources given on the sensitivity report. The profit appears to be more sensitive to changes in resources with higher shadow prices. The profit appears to not change at all for resources with shadow prices less than 1. The profit appears to be more sensitive to changes in resources with lower shadow prices. As the RHS constraint increases, the profit appears to decrease for resources with lower shadow prices and increase for resources with higher shadow prices. As the RHS constraint increases, the profit appears to increase for resources with lower shadow prices and decrease for resources with higher shadow prices. h) Suppose there in some uncertainty about the amount of pressing capacity that might be available. Create a Solver Table report summarizing how the optimal solution and profit changes as the amount of pressing capacity available changes from 5,000 to 7,000 in increments of 500. What information does this report convey about the optimal product mix as a function of the available pressing capacity? As pressing capacity increases from 5,000 to 7,000, the optimal number of Tahoe pallets , the optimal number of Pacific pallets , the optimal number of Savannah pallets , and the optimal number of Aspen pallets Bearland Manufacturing produces 4 different types of wood paneling. Each type of paneling is made by gluing and pressing together a different mixture of pine and oak chips. The following table summarizes the required amount of gluing, pressing, and mixture of wood chips required to produce a pallet of 50 units of each type of paneling: Assume the company has 6,000 quarts of glue; 7,500 hours of pressing capacity; 30,000 pounds of pine chips; and 62,500 pounds of oak chips available in the next production cycle. Further assume that each pallet of Tahoe, Pacific, Savannah, and Aspen panels can be sold for profits of \\( \\$ 440, \\$ 1,140, \\$ 790 \\), and \\( \\$ 390 \\), respectively. Finally, for marketing purposes, the company wants to produce at least 4 pallets of each type of paneling. Formulate an LP model, then use Solver to create a Sensitivity Report for your model and answer the following questions. (a) Is the solution degenerate? Yes No (b) Is the solution unique? Some of the allowable increase or decrease values for the objective coefficients are zero, so there are alternate optimal solutions. None of the allowable increase or decrease values for the objective coefficients are zero, so the optimal solution is unique. None of the allowable increase or decrease values for the RHS values are zero, so the optimal solution is unique. We cannot determine if the optimal solution is unique based on our sensitivity report because the solution is degenerate. Some of the allowable increase or decrease values for the RHS values are zero, so there are alternate optimal solutions. (c) Suppose the profit per pallet of Tahoe panels went down by \\( \\$ 35 \\). Would the optimal solution change? Yes No (d) Suppose the profit per pallet of Aspen panels went up by \\( \\$ 40 \\). Would the optimal solution change? Yes No (e) At most, how much should the company be willing to pay (in dollars) to obtain 1,200 additional hours of pressing capacity? (If it is not worth it to pay for this much additional pressing capacity, enter NA. Round your answer to two decimal places.) \\( \\$ \\) (f) Suppose the company has received an offer to buy 4,900 pounds of its pine chips for \\( \\$ 1,160 \\). Should it accept this offer? Explain your answer. (Give your answer in dollars. Round your answer to two decimal places.) Since \\( \\$ 1,160 \\) is \\( \\$ \\quad \\), it than the amount profit would be reduced if 4,900 pounds of pine chips were removed, sense for the company to accept this offer. g) Create a Spider Plot illustrating how the optimal profit changes as the availability of each of the four resources varies from \90 to \110 of their given values. Explain the relationship between this graph and the shadow prices of the resources given on the sensitivity report. The profit appears to be more sensitive to changes in resources with higher shadow prices. The profit appears to not change at all for resources with shadow prices less than 1. The profit appears to be more sensitive to changes in resources with lower shadow prices. As the RHS constraint increases, the profit appears to decrease for resources with lower shadow prices and increase for resources with higher shadow prices. As the RHS constraint increases, the profit appears to increase for resources with lower shadow prices and decrease for resources with higher shadow prices. h) Suppose there in some uncertainty about the amount of pressing capacity that might be available. Create a Solver Table report summarizing how the optimal solution and profit changes as the amount of pressing capacity available changes from 5,000 to 7,000 in increments of 500. What information does this report convey about the optimal product mix as a function of the available pressing capacity? As pressing capacity increases from 5,000 to 7,000, the optimal number of Tahoe pallets , the optimal number of Pacific pallets , the optimal number of Savannah pallets , and the optimal number of Aspen pallets Bearland Manufacturing produces 4 different types of wood paneling. Each type of paneling is made by gluing and pressing together a different mixture of pine and oak chips. The following table summarizes the required amount of gluing, pressing, and mixture of wood chips required to produce a pallet of 50 units of each type of paneling: Assume the company has 6,000 quarts of glue; 7,500 hours of pressing capacity; 30,000 pounds of pine chips; and 62,500 pounds of oak chips available in the next production cycle. Further assume that each pallet of Tahoe, Pacific, Savannah, and Aspen panels can be sold for profits of \\( \\$ 440, \\$ 1,140, \\$ 790 \\), and \\( \\$ 390 \\), respectively. Finally, for marketing purposes, the company wants to produce at least 4 pallets of each type of paneling. Formulate an LP model, then use Solver to create a Sensitivity Report for your model and answer the following questions. (a) Is the solution degenerate? Yes No (b) Is the solution unique? Some of the allowable increase or decrease values for the objective coefficients are zero, so there are alternate optimal solutions. None of the allowable increase or decrease values for the objective coefficients are zero, so the optimal solution is unique. None of the allowable increase or decrease values for the RHS values are zero, so the optimal solution is unique. We cannot determine if the optimal solution is unique based on our sensitivity report because the solution is degenerate. Some of the allowable increase or decrease values for the RHS values are zero, so there are alternate optimal solutions. (c) Suppose the profit per pallet of Tahoe panels went down by \\( \\$ 35 \\). Would the optimal solution change? Yes No (d) Suppose the profit per pallet of Aspen panels went up by \\( \\$ 40 \\). Would the optimal solution change? Yes No (e) At most, how much should the company be willing to pay (in dollars) to obtain 1,200 additional hours of pressing capacity? (If it is not worth it to pay for this much additional pressing capacity, enter NA. Round your answer to two decimal places.) \\( \\$ \\) (f) Suppose the company has received an offer to buy 4,900 pounds of its pine chips for \\( \\$ 1,160 \\). Should it accept this offer? Explain your answer. (Give your answer in dollars. Round your answer to two decimal places.) Since \\( \\$ 1,160 \\) is \\( \\$ \\quad \\), it than the amount profit would be reduced if 4,900 pounds of pine chips were removed, sense for the company to accept this offer
Step by Step Solution
There are 3 Steps involved in it

Get step-by-step solutions from verified subject matter experts