

Question: G ezto.mheducation.com + Content M Question 3 - Wk 4 - Practice: Wk 4 Exercises [due Day 5] - Connect Homework Help - Q&A from
![Practice: Wk 4 Exercises [due Day 5] - Connect Homework Help -](https://s3.amazonaws.com/si.experts.images/answers/2024/06/667df8fc34776_772667df8fc05460.jpg)
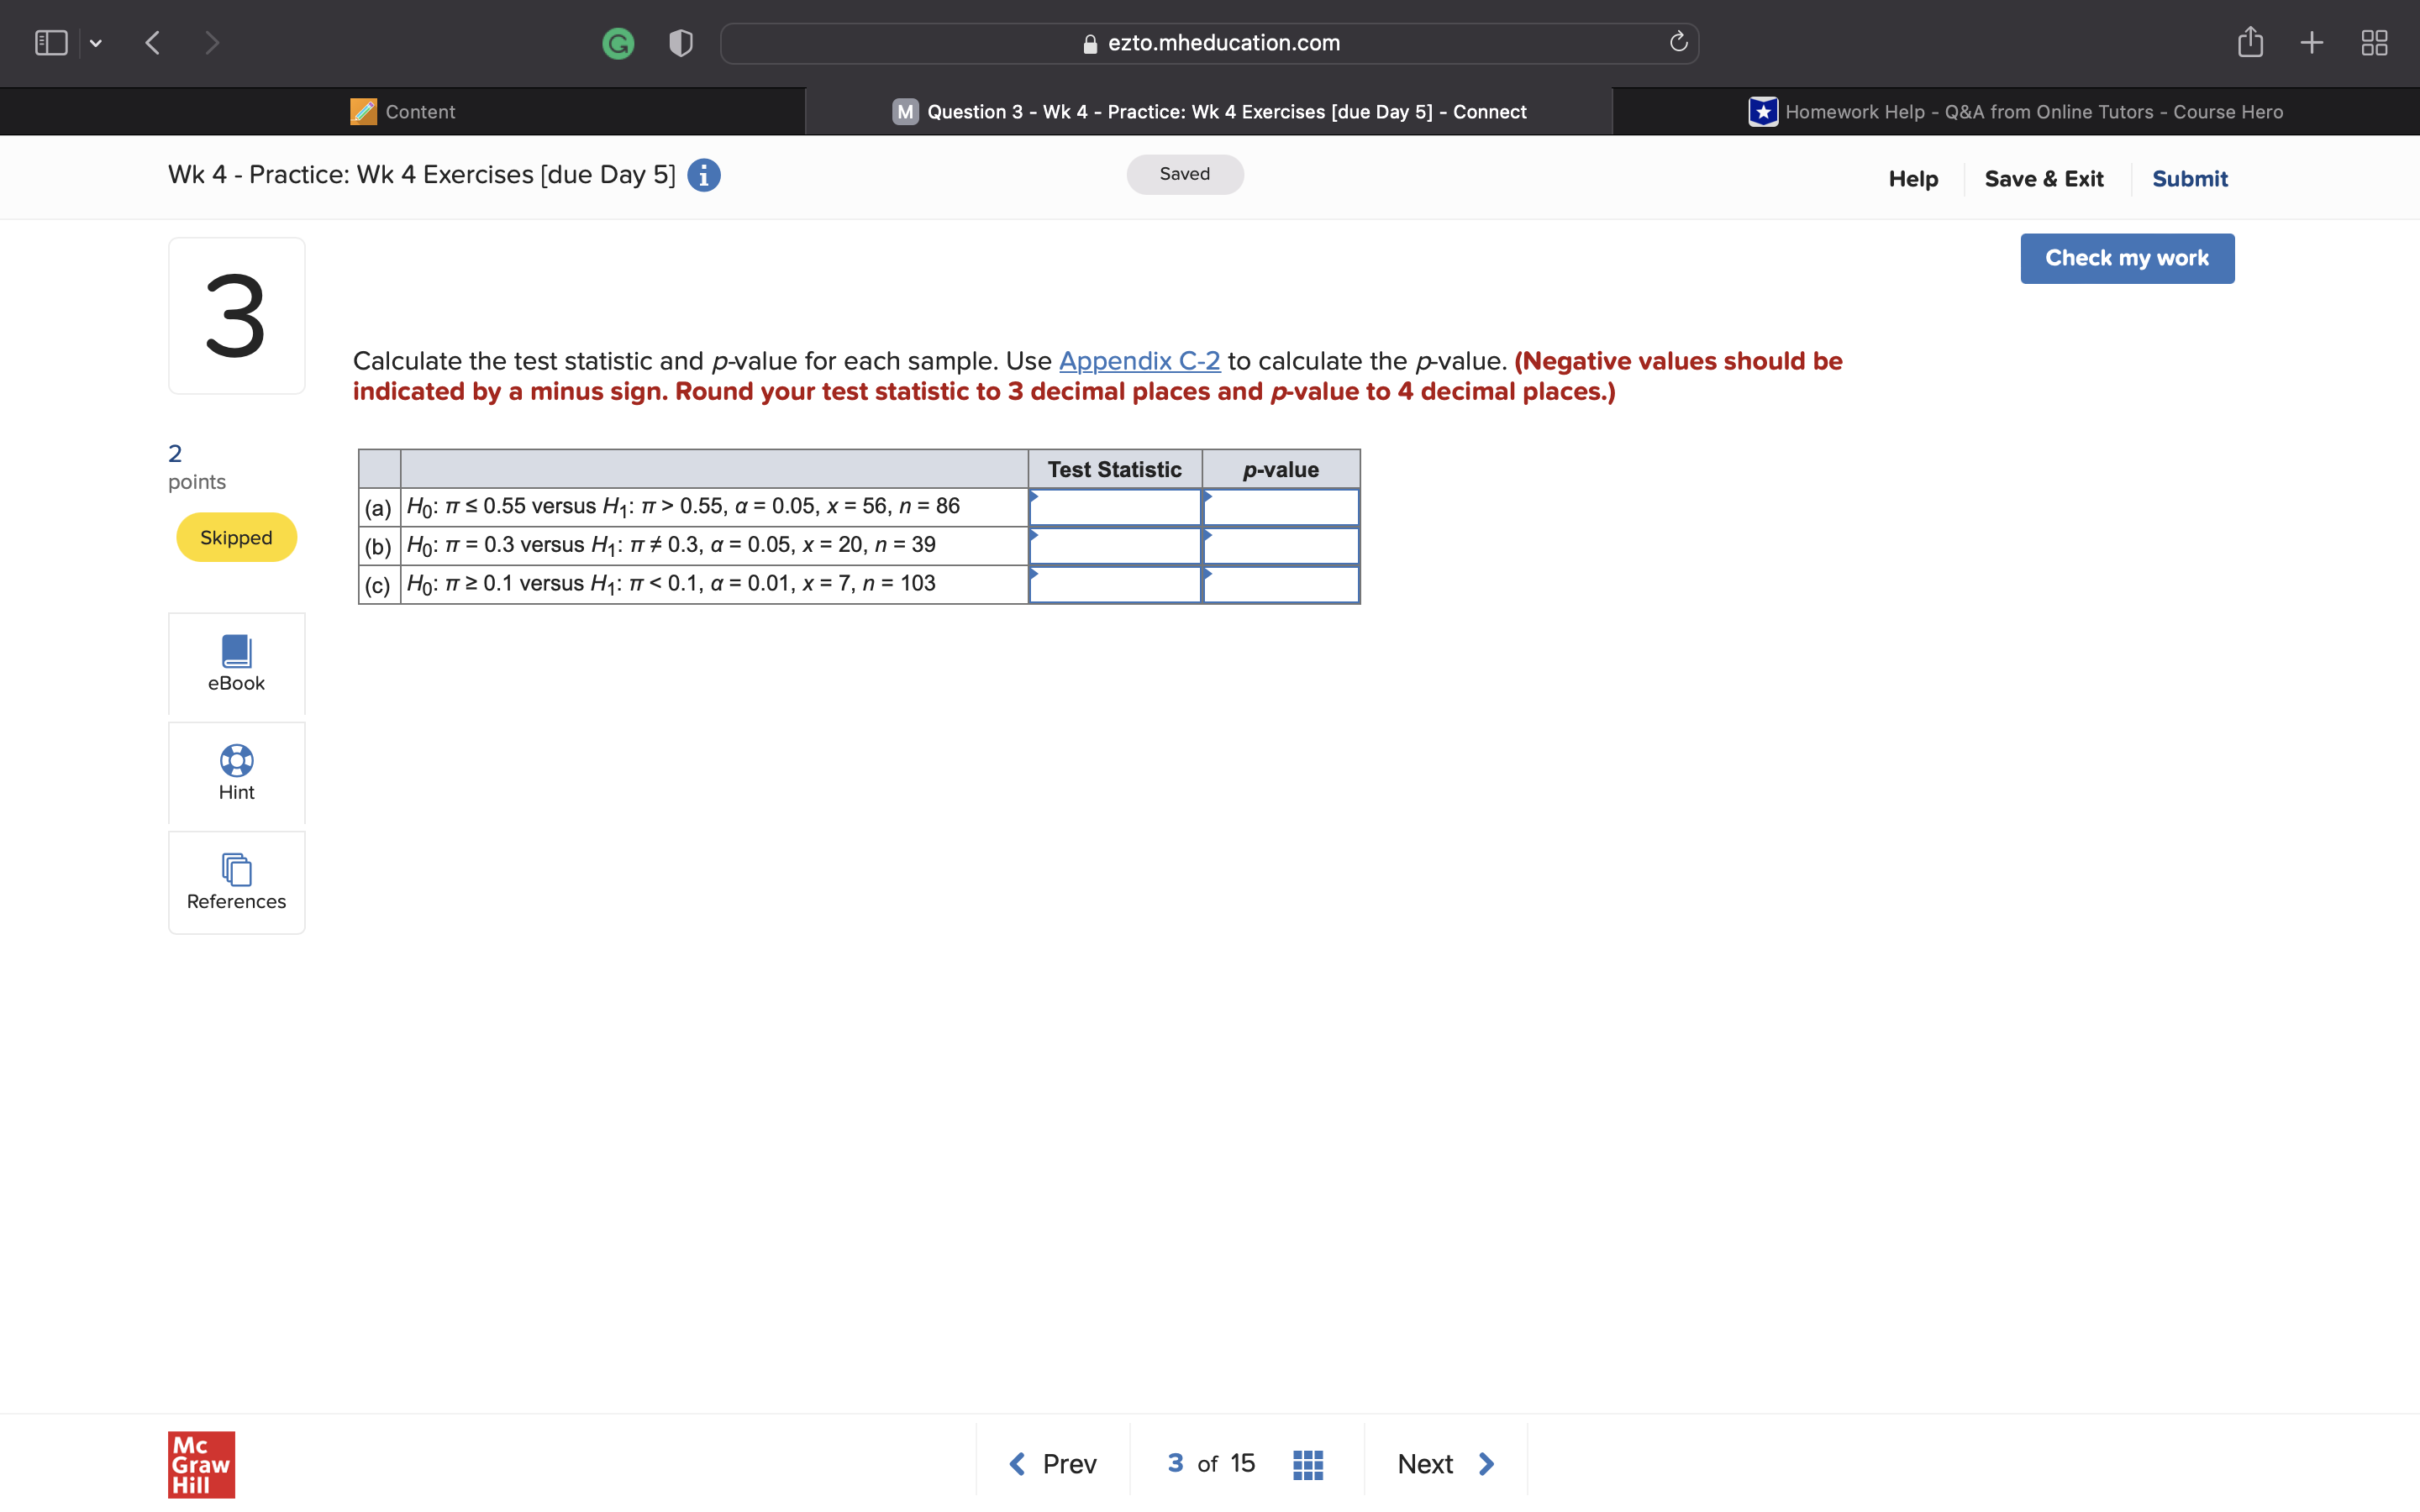
G ezto.mheducation.com + Content M Question 3 - Wk 4 - Practice: Wk 4 Exercises [due Day 5] - Connect Homework Help - Q&A from Online Tutors - Course Hero Wk 4 - Practice: Wk 4 Exercises [due Day 5] i Saved Help Save & Exit Submit Check my work 3 Calculate the test statistic and p-value for each sample. Use Appendix C-2 to calculate the p-value. (Negative values should be indicated by a minus sign. Round your test statistic to 3 decimal places and p-value to 4 decimal places.) 2 Test Statistic points p-value (a) Ho: IT S 0.55 versus H1: IT > 0.55, a = 0.05, x = 56, n = 86 Skipped (b) Ho: TT = 0.3 versus H1: IT # 0.3, a = 0.05, x = 20, n = 39 (c) Ho: TT 2 0.1 versus H1: IT Hill
Step by Step Solution
There are 3 Steps involved in it

Get step-by-step solutions from verified subject matter experts