

Question: ( g ) ( h ) ( i ) Figure Q 6 . Q 7 - In the diode circuits ( a ) , (
g
h
i
Figure Q
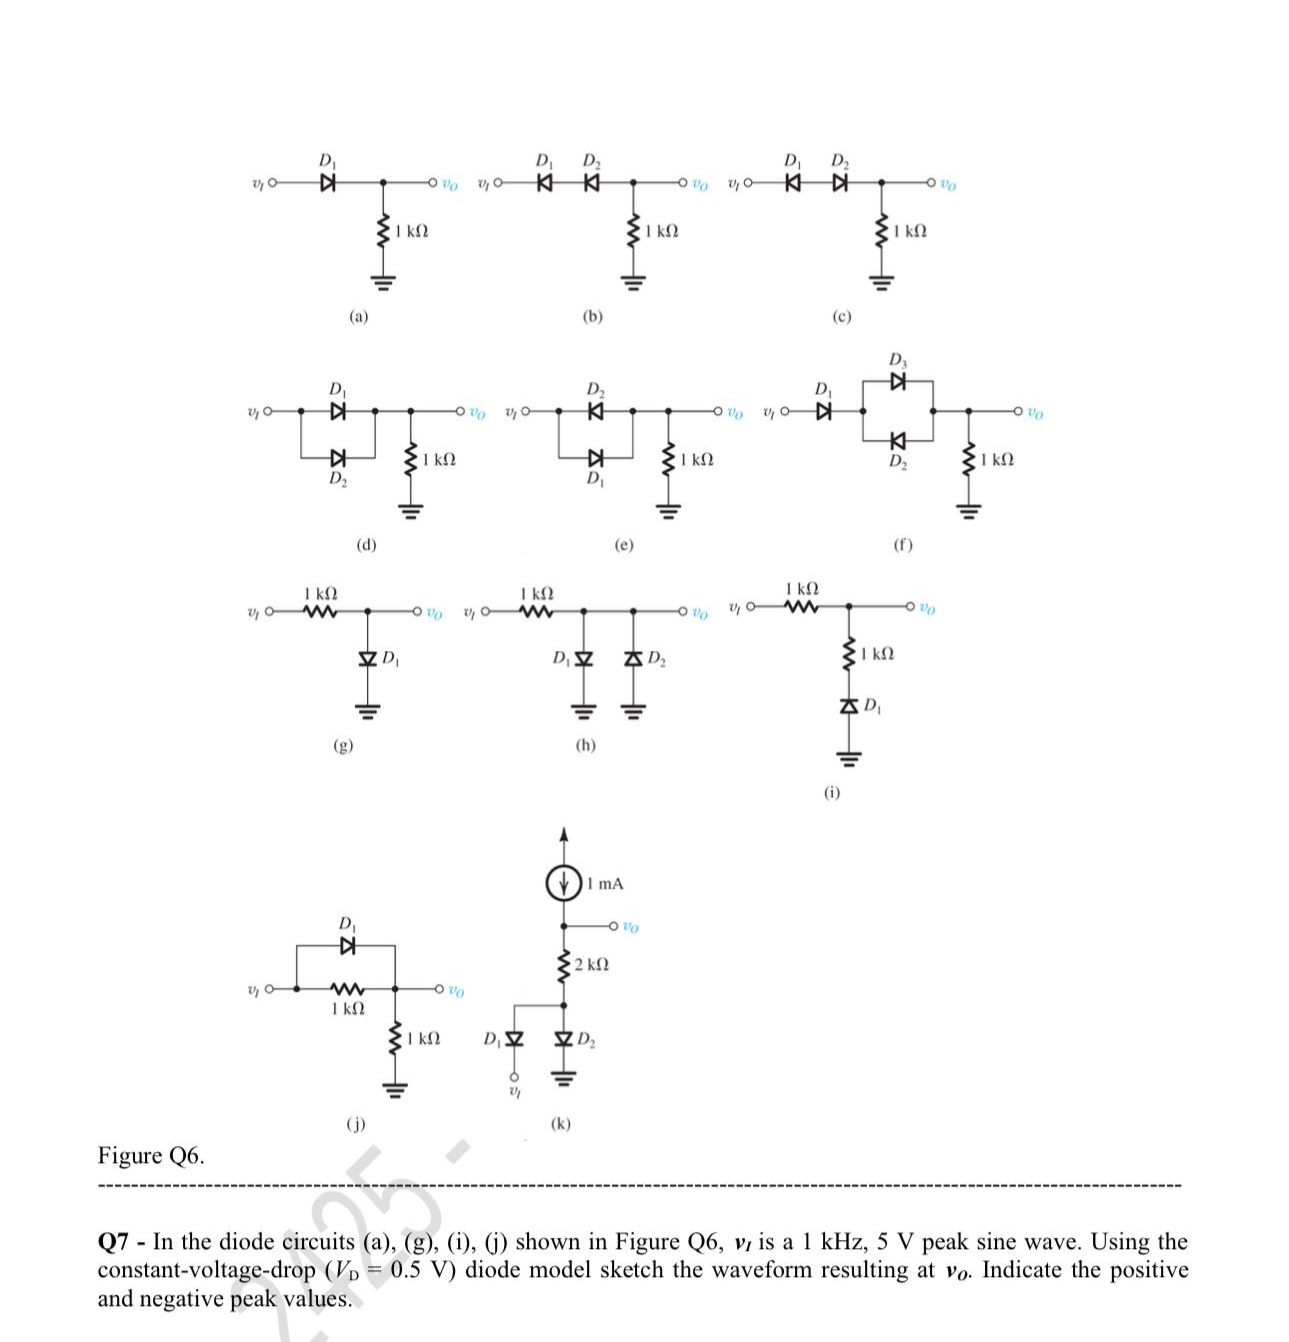
Q In the diode circuits agij shown in Figure Q is a peak sine wave. Using the constantvoltagedrop diode model sketch the waveform resulting at Indicate the positive and negative peak values.
Step by Step Solution
There are 3 Steps involved in it
1 Expert Approved Answer
Step: 1 Unlock

Question Has Been Solved by an Expert!
Get step-by-step solutions from verified subject matter experts
Step: 2 Unlock
Step: 3 Unlock