Question: G. Note 22 reports that the balance in Pearson's provision for sales returns was $372 at December 31, 2008 and $354 at December 31, 2009.
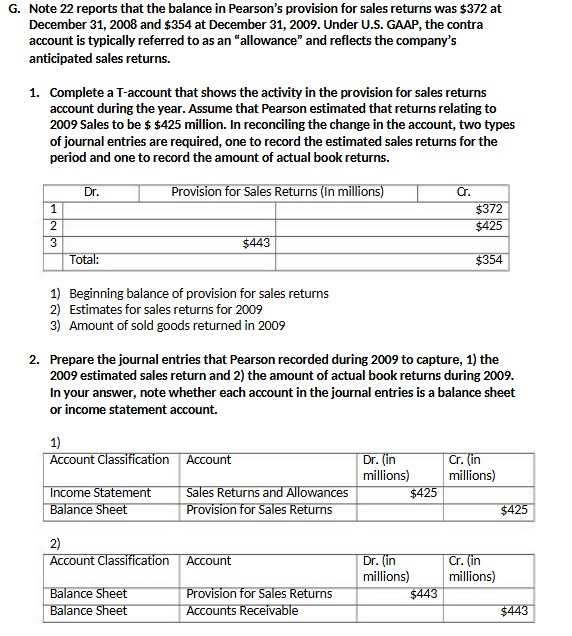
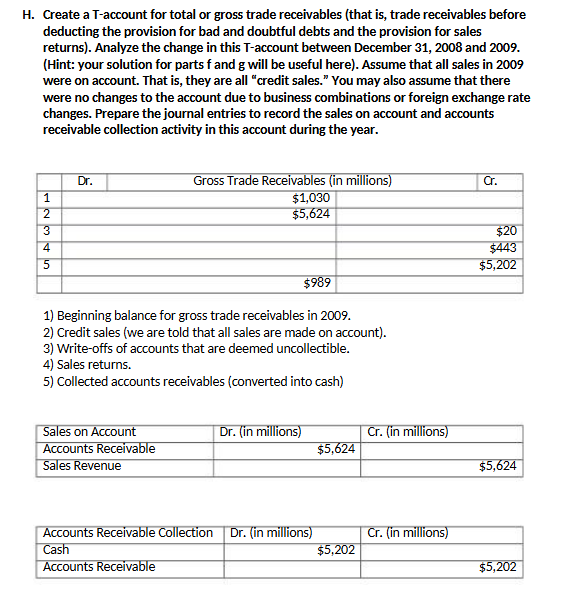
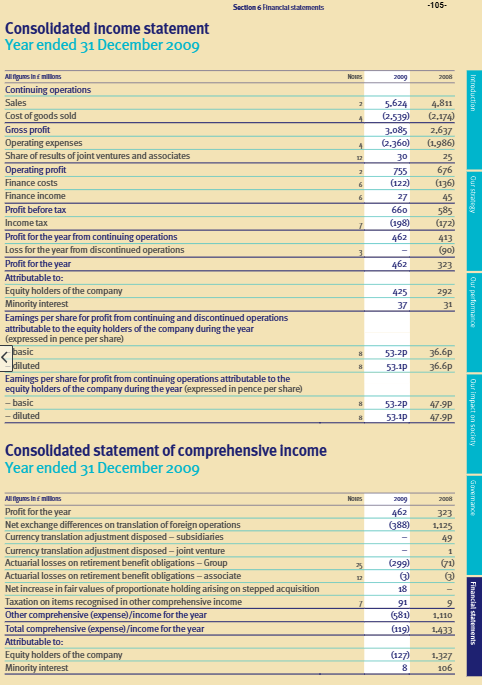
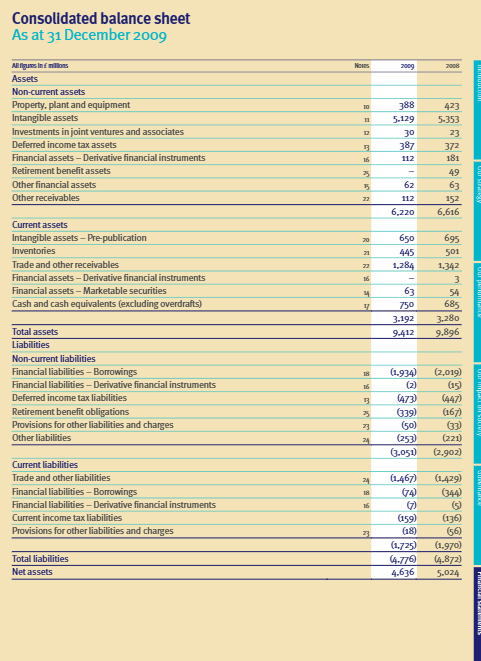
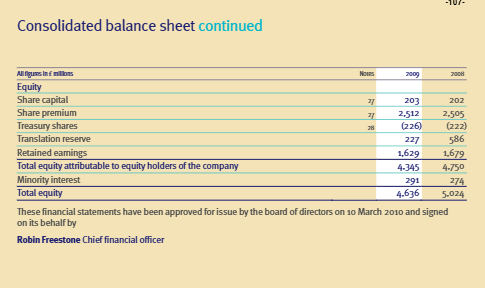
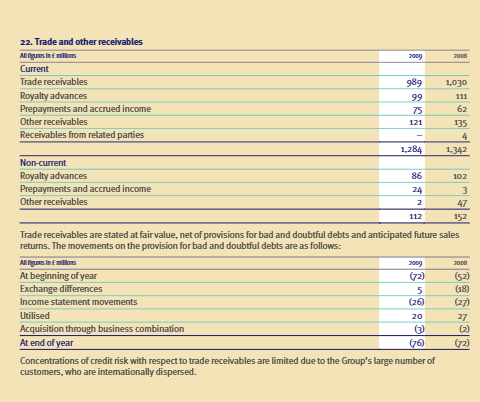
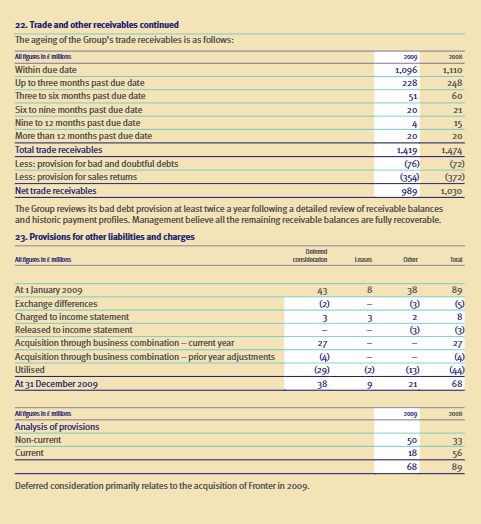
G. Note 22 reports that the balance in Pearson's provision for sales returns was $372 at December 31, 2008 and $354 at December 31, 2009. Under U.S. GAAP, the contra account is typically referred to as an "allowance" and reflects the company's anticipated sales returns. 1. Complete a T-account that shows the activity in the provision for sales returns account during the year. Assume that Pearson estimated that returns relating to 2009 Sales to be $ $425 million. In reconciling the change in the account, two types of journal entries are required, one to record the estimated sales returns for the period and one to record the amount of actual book returns. Dr. Provision for Sales Returns (In millions) Or. 1 $372 2 $425 3 $443 Total: $354 1) Beginning balance of provision for sales returns 2) Estimates for sales returns for 2009 3) Amount of sold goods returned in 2009 2. Prepare the journal entries that Pearson recorded during 2009 to capture, 1) the 2009 estimated sales return and 2) the amount of actual book returns during 2009. In your answer, note whether each account in the journal entries is a balance sheet or income statement account. 1) Account Classification Account Dr. (in Cr. (in millions) millions) Income Statement Sales Returns and Allowances $425 Balance Sheet Provision for Sales Returns $425 2) Account Classification Account Dr. (in Cr. (in millions) millions) Balance Sheet Provision for Sales Returns $443 Balance Sheet Accounts Receivable $443H. Create a T-account for total or gross trade receivables (that is, trade receivables before deducting the provision for bad and doubtful debts and the provision for sales returns). Analyze the change in this T-account between December 31, 2008 and 2009. {Hint: your solution for parts f and g will be useful here). Assume that all sales in 2009 were on account. That is, they are all \"credit sales.\" You may also assume that there were no changes to the account due to business combinations or foreign exchange rate changes. Prepare the journal entries to record the sales on account and accounts receivable collection activity in this account during the year. | Dr. Gross Trade Receivables {in millions) r. 1| . $1,030 | : TZ | 5,624 g ] 90 Z T = | 5000 | $989 ' 1) Beginning balance for gross trade receivables in 20079, 2] Credit sales (we are told that all sales are made on account). 3) Write-offs of accounts that are deemed uncollectible. 4) Sales returns. 5) Collected accounts receivables (converted into cash) Sales on Account Accounts Recelvable Sales Revenue Accounts Receivable Collection | Dr. {in millions] Cr. (in millions) Accounts Recelvable Section 5 Financial statements -105- Consolidated Income statement Year ended 31 December 2009 Alfigure Infrillors HOURS 3004 300H Continuing operations Immduction Sales 5.624 4.811 Cost of goods sold 4 (2.539) (2,174) Gross profit 3.085 2,637 Operating expenses 4 (2,360) (1,986) Share of results of joint ventures and associates 12 30 25 Operating profit 755 676 Finance costs (122) (9ET) Finance income 27 45 Profit before tax 560 585 Income tax 7 (198) (172) Profit for the year from continuing operations 462 413 Loss for the year from discontinued operations 3 (go) Profit for the year 462 327 Attributable to: Equity holders of the company 425 292 Minority interest 37 31 Earnings per share for profit from continuing and discontinued operations attributable to the equity holders of the company during the year (expressed in pence per share) basic 53-2p 36.6p diluted 53-1p 36.6p Earnings per share for profit from continuing operations attributable to the equity holders of the company during the year (expressed in pence per share) - basic 53-2p 47-9P Our impact on society diluted 53-1p 47-9P Consolidated statement of comprehensive income Year ended 31 December 2009 All figures Infrillous HOURS 3007 Profit for the year 462 323 Net exchange differences on translation of foreign operations (388) 1,125 Currency translation adjustment disposed - subsidiaries 49 Currency translation adjustment disposed - joint venture 1 Actuarial losses on retirement benefit obligations - Group 35 (299) (71) Actuarial losses on retirement benefit obligations - associate Net increase in fair values of proportionate holding arising on stepped acquisition 18 - Taxation on items recognised in other comprehensive income 91 Other comprehensive (expense)/income for the year 581 1,110 Financial staff tents Total comprehensive (expense)/income for the year (119) 1,433 Attributable to: Equity holders of the company (127) 1.327 Minority interest 106Consolidated balance sheet As at 31 December 2009 AlfigureInfrillous HOURS 3004 3008 Assets Non-current assets Property, plant and equipment 18 8 423 Intangible assets 11 5-129 5-353 Investments in joint ventures and associates 12 30 23 Deferred income tax assets 387 372 Financial assets - Derivative financial instruments 112 181 Retirement benefit assets 49 Other financial assets 15 62 63 Other receivables 112 152 6.220 6,616 Current assets Intangible assets - Pre-publication 650 695 Inventories 445 501 Trade and other receivables 1,284 1,342 Financial assets - Derivative financial instruments 16 3 Financial assets - Marketable securities 63 54 Cash and cash equivalents (excluding overdrafts) 750 585 3-192 3.280 Total assets 9.412 9.896 Liabilities Non-current liabilities Financial liabilities - Borrowings (1.934) (2,019) Financial liabilities - Derivative financial instruments 16 (2) (15) Deferred income tax liabilities (473) (447) Retirement benefit obligations (339) (167) Provisions for other liabilities and charges (50) (37) Other liabilities (257) (221) (3.051) (2,902) Current liabilities Trade and other liabilities 24 (1.467) Financial liabilities - Borrowings 18 (74 (344) Financial liabilities - Derivative financial instruments (7) Current income tax liabilities (159) (176) Provisions for other liabilities and charges (18) (56) (1,725) (1.970) Total liabilities 4.776 4.872) Net assets 4.636 5-024Consolidated balance sheet continued 3401 Equity Share capital 203 202 Share premium 2,512 2.505 Treasury shares (226) (222) Translation reserve 227 586 Retained earnings 1,629 1,679 Total equity attributable to equity holders of the company 4-345 4-750 Minority interest 291 274 Total equity 4.636 5-024 These financial statements have been approved for issue by the board of directors on 10 March 2010 and signed on its behalf by Robin Freestone Chief financial officer22. Trade and other receivables Allfigure In follows 3009 30OH Current Trade receivables 989 1,030 Royalty advances 99 141 Prepayments and accrued income 75 62 Other receivables 121 135 Receivables from related parties 4 1.284 1,342 Non-current Royalty advances 86 102 Prepayments and accrued income 24 3 Other receivables 2 47 112 152 Trade receivables are stated at fair value, net of provisions for bad and doubtful debts and anticipated future sales returns. The movements on the provision for bad and doubtful debts are as follows: 3000 At beginning of year (72) (521 Exchange differences 5 Income statement movements (26) (27) Utilised 20 27 Acquisition through business combination (2) At end of year (76 (72 Concentrations of credit risk with respect to trade receivables are limited due to the Group's large number of customers, who are internationally dispersed.22. Trade and other receivables continued The ageing of the Group's trade receivables is as follows: 3009 Within due date 1,096 1,110 Up to three months past due date 228 248 Three to six months past due date 51 60 Six to nine months past due date 20 21 Nine to 12 months past due date 4 15 More than 12 months past due date 20 20 Total trade receivables 1.419 1,474 Less: provision for bad and doubtful debts (76) (72) Less: provision for sales returns (354) (372) Net trade receivables 989 1,070 The Group reviews its bad debt provision at least twice a year following a detailed review of receivable balances and historic payment profiles. Management believe all the remaining receivable balances are fully recoverable. 23. Provisions for other liabilities and charges MinigunsInfollows conddemion Other Topl At 1 January 2009 43 B 89 Exchange differences (2) (7) Charged to income statement 3 3 2 Released to income statement - - (7) (7) Acquisition through business combination - current year 27 - - 27 Acquisition through business combination - prior year adjustments (4) - (4) Utilised (29) (2) (17) (44) At 31 December 2009 9 21 68 3000 Analysis of provisions Non-current 50 33 Current 18 56 8g Deferred consideration primarily relates to the acquisition of Fronter in 2009
Step by Step Solution
There are 3 Steps involved in it
1 Expert Approved Answer
Step: 1 Unlock
Question Has Been Solved by an Expert!
Get step-by-step solutions from verified subject matter experts
Step: 2 Unlock
Step: 3 Unlock
Students Have Also Explored These Related Accounting Questions!