

Question: G PG No A B 1 Date SP500 KO 2 1/1/2015 3656.28 3 2/1/2015 3866.4199 4 3/1/2015 3805.27 5 4/1/2015 3841.78 6 5/1/2015 3891.1799 7
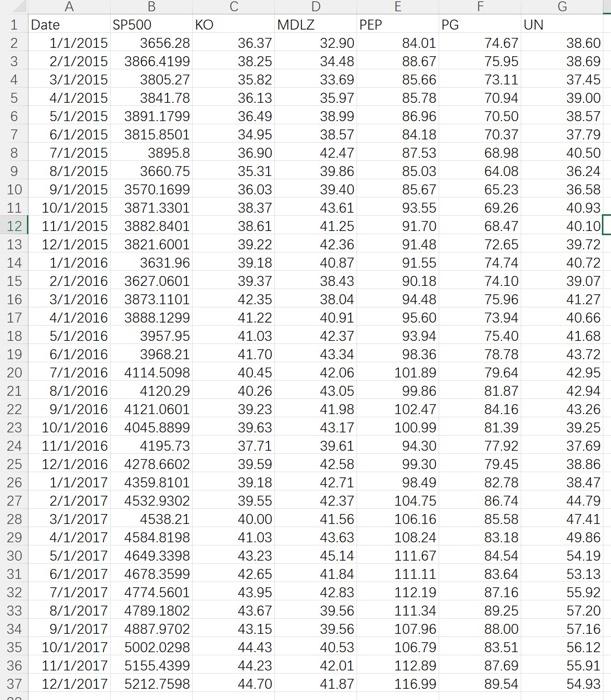
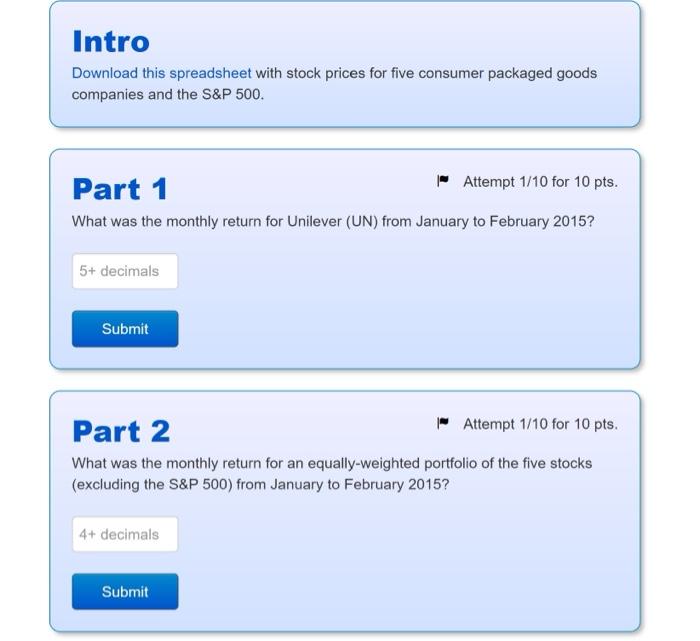
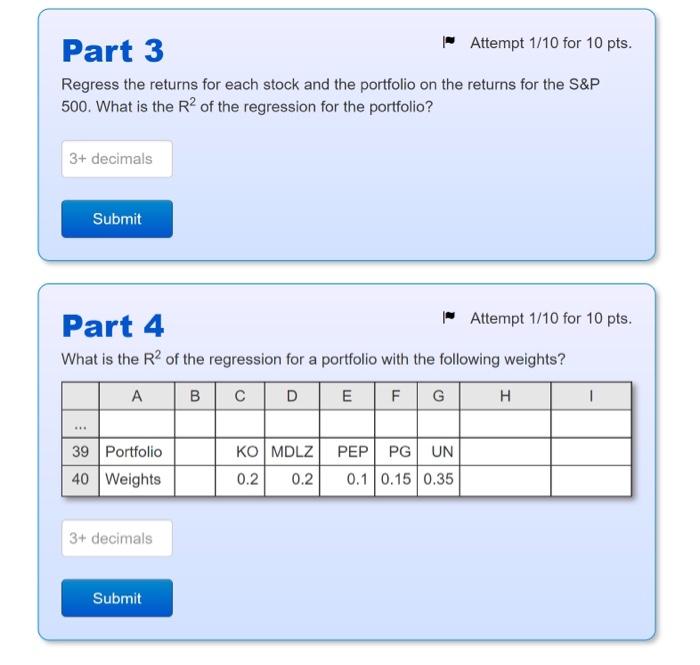
G PG No A B 1 Date SP500 KO 2 1/1/2015 3656.28 3 2/1/2015 3866.4199 4 3/1/2015 3805.27 5 4/1/2015 3841.78 6 5/1/2015 3891.1799 7 6/1/2015 3815.8501 8 7/1/2015 3895.8 9 8/1/2015 3660.75 10 9/1/2015 3570.1699 11 10/1/2015 3871.3301 12 11/1/2015 3882.8401 13 12/1/2015 3821.6001 14 1/1/2016 3631.96 15 2/1/2016 3627.0601 16 3/1/2016 3873.1101 17 4/1/2016 3888.1299 18 5/1/2016 3957.95 19 6/1/2016 3968.21 20 7/1/2016 4114.5098 21 8/1/2016 4120.29 22 9/1/2016 4121.0601 23 10/1/2016 4045.8899 24 11/1/2016 4195.73 12/1/2016 4278.6602 26 1/1/2017 4359.8101 2/1/2017 4532.9302 28 3/1/2017 4538.21 29 4/1/2017 4584.8198 30 5/1/2017 4649.3398 31 6/1/2017 4678.3599 32 7/1/2017 4774.5601 33 8/1/2017 4789.1802 34 9/1/2017 4887.9702 35 10/1/2017 5002.0298 36 11/1/2017 5155.4399 37 12/1/2017 5212.7598 D MDLZ PEP 36.37 32.90 38.25 34.48 35.82 33.69 36.13 35.97 36.49 38.99 34.95 38.57 36.90 42.47 35.31 39.86 36.03 39.40 38.37 43.61 38.61 41.25 39.22 42.36 39.18 40.87 39.37 38.43 42.35 38.04 41.22 40.91 41.03 42.37 41.70 43.34 40.45 42.06 40.26 43.05 39.23 41.98 39.63 43.17 37.71 39.61 39.59 42.58 39.18 42.71 39.55 42.37 40.00 41.56 41.03 43.63 43.23 45.14 42.65 41.84 43.95 42.83 43.67 39.56 43.15 39.56 44.43 40.53 44.23 42.01 44.70 41.87 84.01 88.67 85.66 85.78 86.96 84.18 87.53 85.03 85.67 93.55 91.70 91.48 91.55 90.18 94.48 95.60 93.94 98.36 101.89 99.86 102.47 100.99 94.30 99.30 98.49 104.75 106.16 108.24 111.67 111.11 112.19 111.34 107.96 106.79 112.89 116.99 UN 74.67 75.95 73.11 70.94 70.50 70.37 68.98 64.08 65.23 69.26 68.47 72.65 74.74 74.10 75.96 73.94 75.40 78.78 79.64 81.87 84.16 81.39 77.92 79.45 82.78 86.74 85.58 83.18 84.54 83.64 87.16 89.25 88.00 83.51 87.69 89.54 38.60 38.69 37.45 39.00 38.57 37.79 40.50 36.24 36.58 40.93 40.10 39.72 40.72 39.07 41.27 40.66 41.68 43.72 42.95 42.94 43.26 39.25 37.69 38.86 38.47 44.79 47.41 49.86 54.19 53.13 55.92 57.20 57.16 56.12 55.91 54.93 25 27 Intro Download this spreadsheet with stock prices for five consumer packaged goods companies and the S&P 500. Part 1 Attempt 1/10 for 10 pts. What was the monthly return for Unilever (UN) from January to February 2015? 5+ decimals Submit Part 2 Attempt 1/10 for 10 pts. What was the monthly return for an equally-weighted portfolio of the five stocks (excluding the S&P 500) from January to February 2015? 4+ decimals Submit Part 3 Attempt 1/10 for 10 pts. Regress the returns for each stock and the portfolio on the returns for the S&P 500. What is the R2 of the regression for the portfolio? 3+ decimals Submit Part 4 Attempt 1/10 for 10 pts. What is the R2 of the regression for a portfolio with the following weights? B D E F G H 1 *** 39 Portfolio 40 Weights KO MDLZ 0.2 0.2 PEP PG UN 0.1 0.15 0.35 3+ decimals Submit G PG No A B 1 Date SP500 KO 2 1/1/2015 3656.28 3 2/1/2015 3866.4199 4 3/1/2015 3805.27 5 4/1/2015 3841.78 6 5/1/2015 3891.1799 7 6/1/2015 3815.8501 8 7/1/2015 3895.8 9 8/1/2015 3660.75 10 9/1/2015 3570.1699 11 10/1/2015 3871.3301 12 11/1/2015 3882.8401 13 12/1/2015 3821.6001 14 1/1/2016 3631.96 15 2/1/2016 3627.0601 16 3/1/2016 3873.1101 17 4/1/2016 3888.1299 18 5/1/2016 3957.95 19 6/1/2016 3968.21 20 7/1/2016 4114.5098 21 8/1/2016 4120.29 22 9/1/2016 4121.0601 23 10/1/2016 4045.8899 24 11/1/2016 4195.73 12/1/2016 4278.6602 26 1/1/2017 4359.8101 2/1/2017 4532.9302 28 3/1/2017 4538.21 29 4/1/2017 4584.8198 30 5/1/2017 4649.3398 31 6/1/2017 4678.3599 32 7/1/2017 4774.5601 33 8/1/2017 4789.1802 34 9/1/2017 4887.9702 35 10/1/2017 5002.0298 36 11/1/2017 5155.4399 37 12/1/2017 5212.7598 D MDLZ PEP 36.37 32.90 38.25 34.48 35.82 33.69 36.13 35.97 36.49 38.99 34.95 38.57 36.90 42.47 35.31 39.86 36.03 39.40 38.37 43.61 38.61 41.25 39.22 42.36 39.18 40.87 39.37 38.43 42.35 38.04 41.22 40.91 41.03 42.37 41.70 43.34 40.45 42.06 40.26 43.05 39.23 41.98 39.63 43.17 37.71 39.61 39.59 42.58 39.18 42.71 39.55 42.37 40.00 41.56 41.03 43.63 43.23 45.14 42.65 41.84 43.95 42.83 43.67 39.56 43.15 39.56 44.43 40.53 44.23 42.01 44.70 41.87 84.01 88.67 85.66 85.78 86.96 84.18 87.53 85.03 85.67 93.55 91.70 91.48 91.55 90.18 94.48 95.60 93.94 98.36 101.89 99.86 102.47 100.99 94.30 99.30 98.49 104.75 106.16 108.24 111.67 111.11 112.19 111.34 107.96 106.79 112.89 116.99 UN 74.67 75.95 73.11 70.94 70.50 70.37 68.98 64.08 65.23 69.26 68.47 72.65 74.74 74.10 75.96 73.94 75.40 78.78 79.64 81.87 84.16 81.39 77.92 79.45 82.78 86.74 85.58 83.18 84.54 83.64 87.16 89.25 88.00 83.51 87.69 89.54 38.60 38.69 37.45 39.00 38.57 37.79 40.50 36.24 36.58 40.93 40.10 39.72 40.72 39.07 41.27 40.66 41.68 43.72 42.95 42.94 43.26 39.25 37.69 38.86 38.47 44.79 47.41 49.86 54.19 53.13 55.92 57.20 57.16 56.12 55.91 54.93 25 27 Intro Download this spreadsheet with stock prices for five consumer packaged goods companies and the S&P 500. Part 1 Attempt 1/10 for 10 pts. What was the monthly return for Unilever (UN) from January to February 2015? 5+ decimals Submit Part 2 Attempt 1/10 for 10 pts. What was the monthly return for an equally-weighted portfolio of the five stocks (excluding the S&P 500) from January to February 2015? 4+ decimals Submit Part 3 Attempt 1/10 for 10 pts. Regress the returns for each stock and the portfolio on the returns for the S&P 500. What is the R2 of the regression for the portfolio? 3+ decimals Submit Part 4 Attempt 1/10 for 10 pts. What is the R2 of the regression for a portfolio with the following weights? B D E F G H 1 *** 39 Portfolio 40 Weights KO MDLZ 0.2 0.2 PEP PG UN 0.1 0.15 0.35 3+ decimals Submit
Step by Step Solution
There are 3 Steps involved in it

Get step-by-step solutions from verified subject matter experts