

Question: (g) Using the table from part (f), perform an ANOVA F test to determine whether there is a straight-line relationship between car speed and the
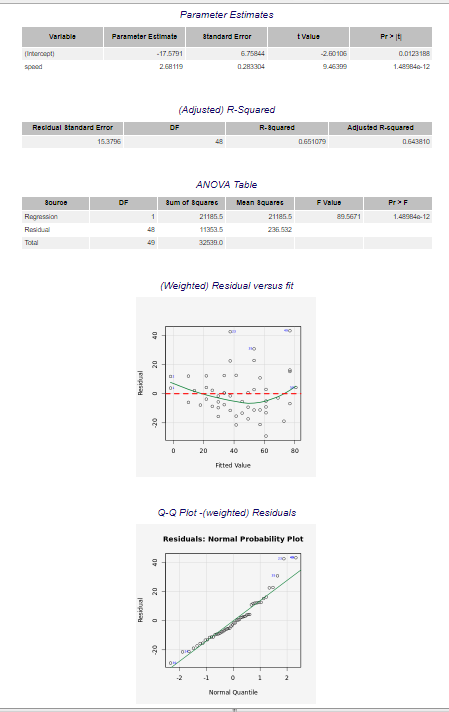
(g) Using the table from part (f), perform an ANOVA F test to determine whether there is a straight-line relationship between car speed and the square root of stopping distance.
(h) Obtain and interpret a 95% confidence interval for the slope of the regression line between speed andsqrtdist.
(i) Predict the stopping distance for a car traveling at 13.2 ft/s (9 mph). (Hint:find,the square root of predicted stopping distance, then transform it back to the original scale)
(j) Obtain the 95% confidence interval for the square root of the mean stopping distance of a car traveling at 13.2 ft/s. Do not interpret it yet.
(k) Obtain the 95% prediction interval for the square root of the stopping distance of an individual car traveling at 13.2 ft/s. Do not interpret it yet.
(l) Transform your answers to parts (j) and (k) back to the original scale. Interpret your new confidence interval and prediction interval in context of the relationship between speed and stopping distance.
(m) Repeat parts (i) through (l) for a speed of 35.2 ft/s (24 mph). Comment on how the width of the confidence and prediction intervals changed.
Pmeder EEE'I'IEIfES [Inn-pa 4151-11 am am mum in\" H115 m1- M 1mm: primed) RSquared 1555 I 41.551519 ml} ANDVA Tabb. mm 1 211m 21135: as" 15049:: Run a 111.35 2554: Tu: a mu mien; Rawalmt QQbefneigmadjm Illlll: m PM\" PM
Step by Step Solution
There are 3 Steps involved in it

Get step-by-step solutions from verified subject matter experts