

Question: G vle.phoenix.edu C + 88 View Assessment Week 2 - MTH/217: Statistics | - Universit... OpenAthens S SAGE Research Methods - The Tao of St...
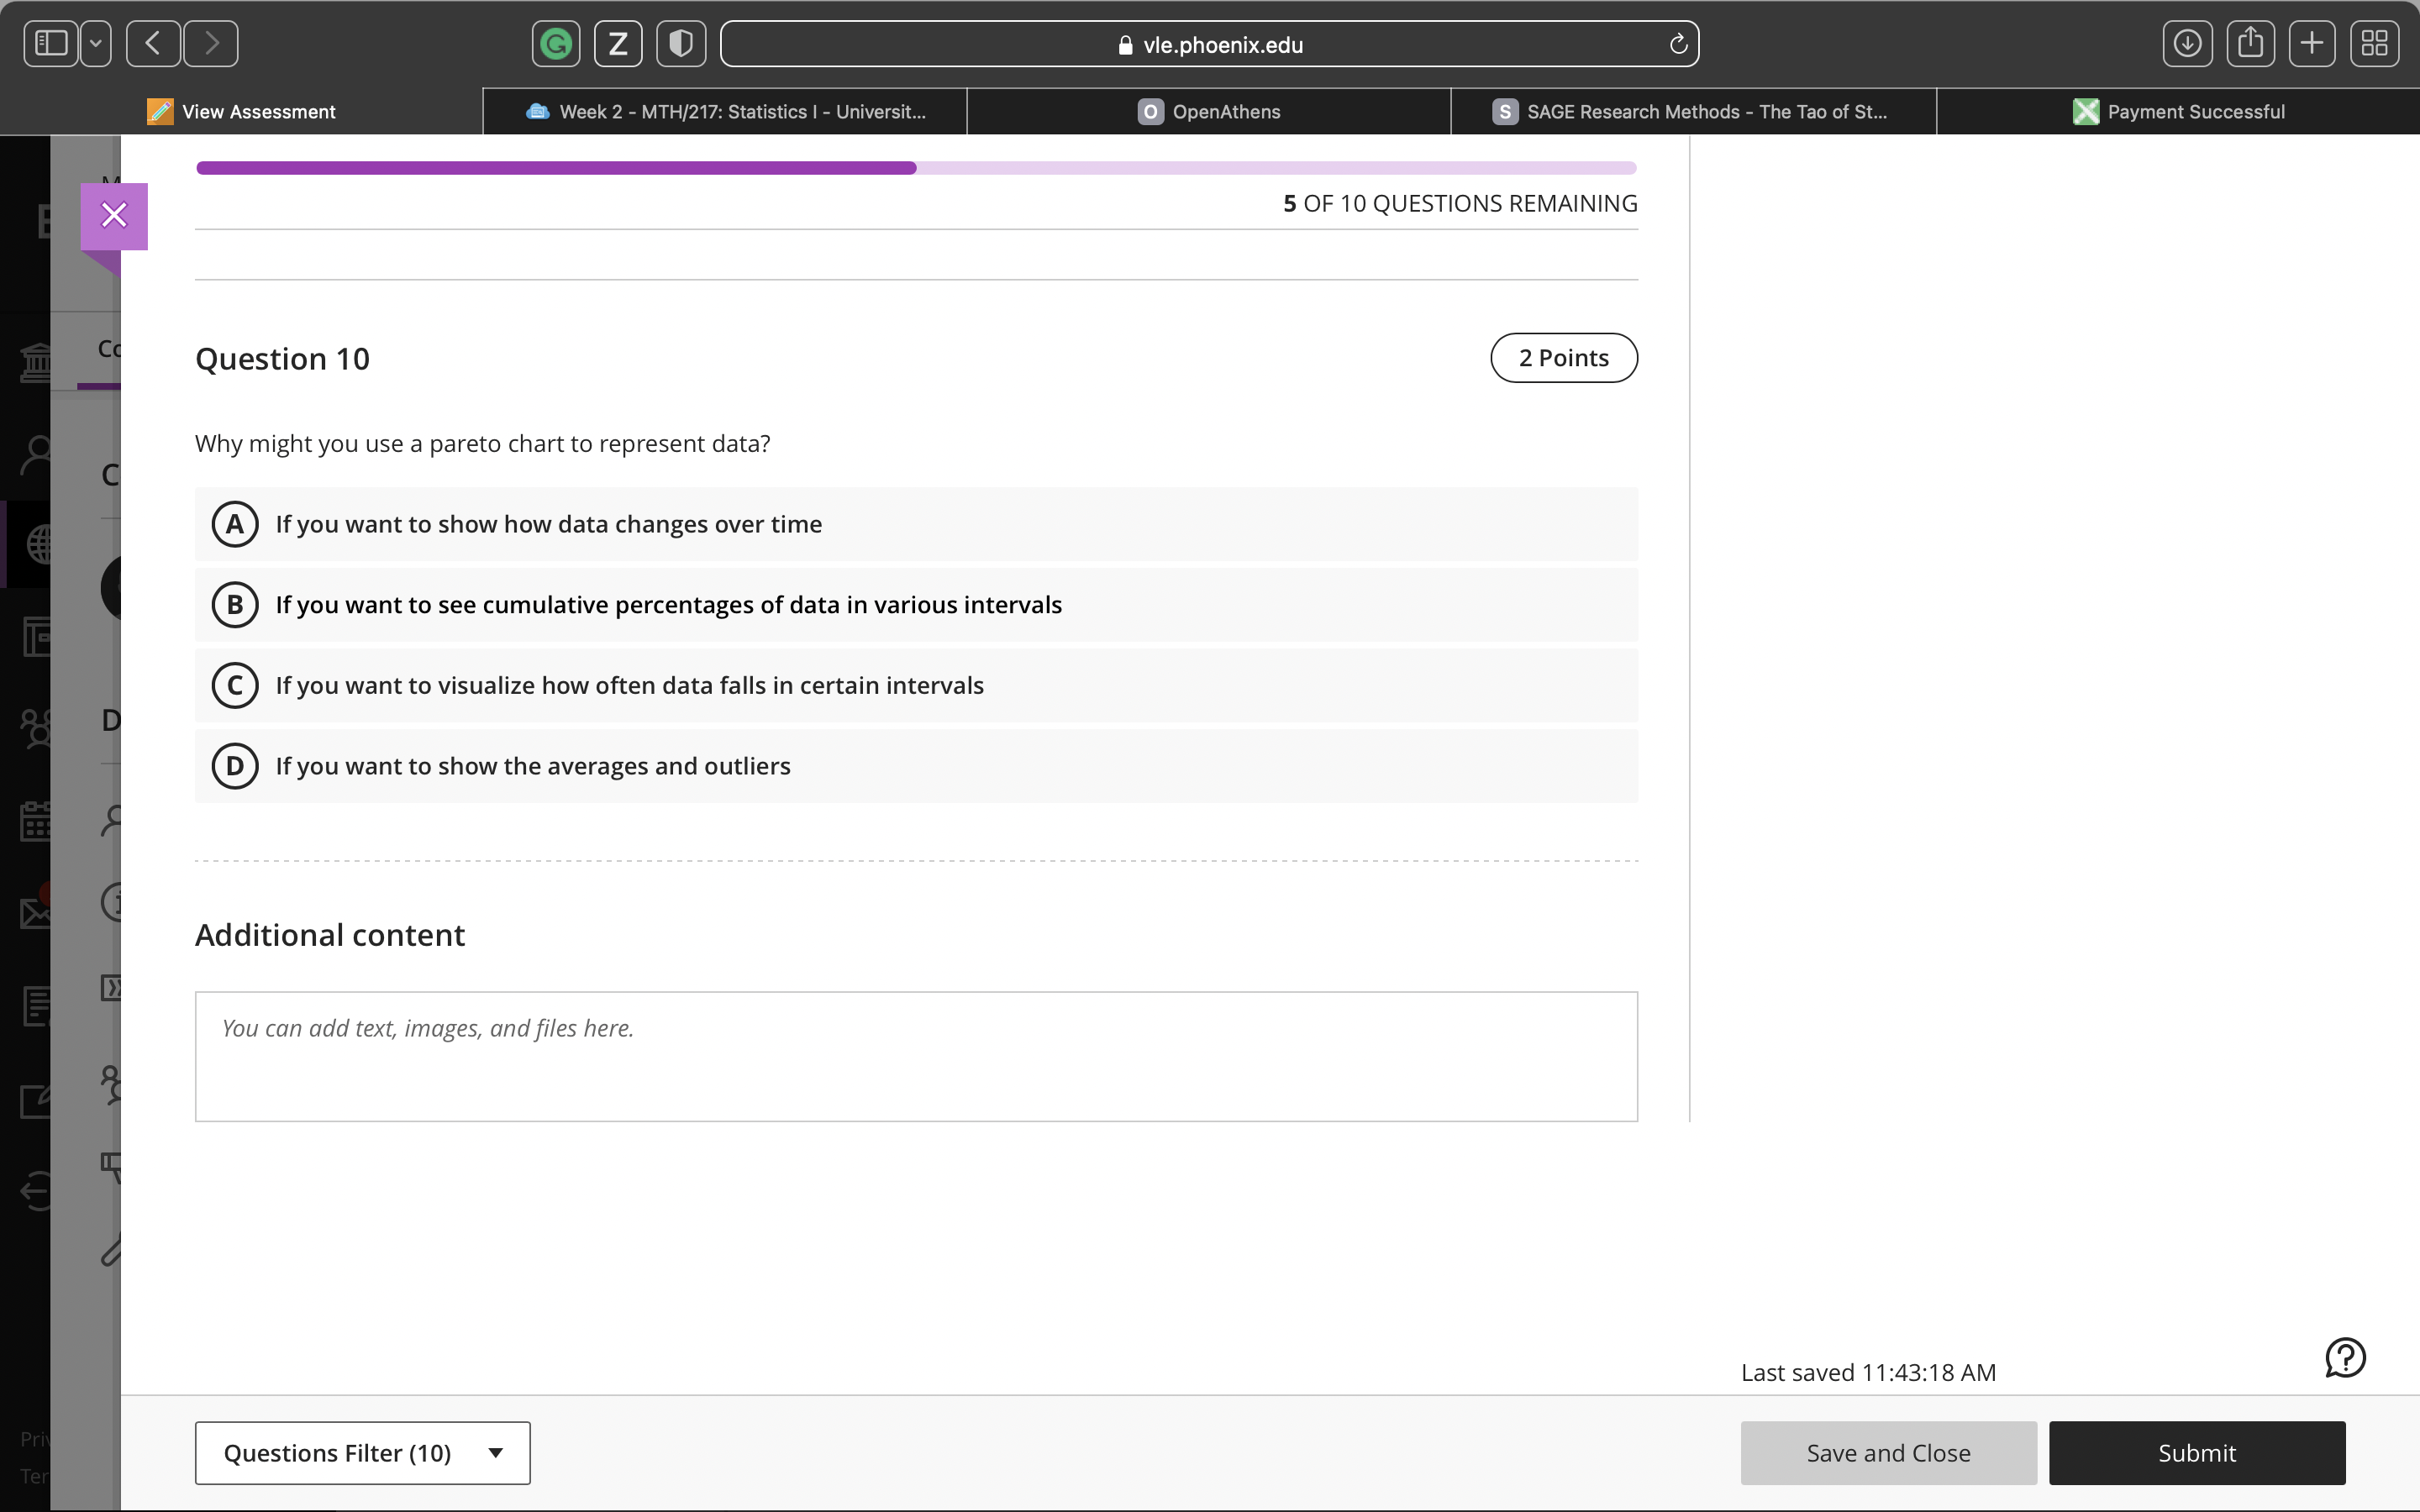
G vle.phoenix.edu C + 88 View Assessment Week 2 - MTH/217: Statistics | - Universit... OpenAthens S SAGE Research Methods - The Tao of St... Payment Successful X 5 OF 10 QUESTIONS REMAINING Question 10 2 Points Why might you use a pareto chart to represent data? A If you want to show how data changes over time B If you want to see cumulative percentages of data in various intervals C If you want to visualize how often data falls in certain intervals D If you want to show the averages and outliers Additional content You can add text, images, and files here. Last saved 11:43:18 AM ? Questions Filter (10) Save and Close Submit
Step by Step Solution
There are 3 Steps involved in it

Get step-by-step solutions from verified subject matter experts