

Question: . . . G X Q64 X V A B C D E F G H I J K L M N 0 P Q
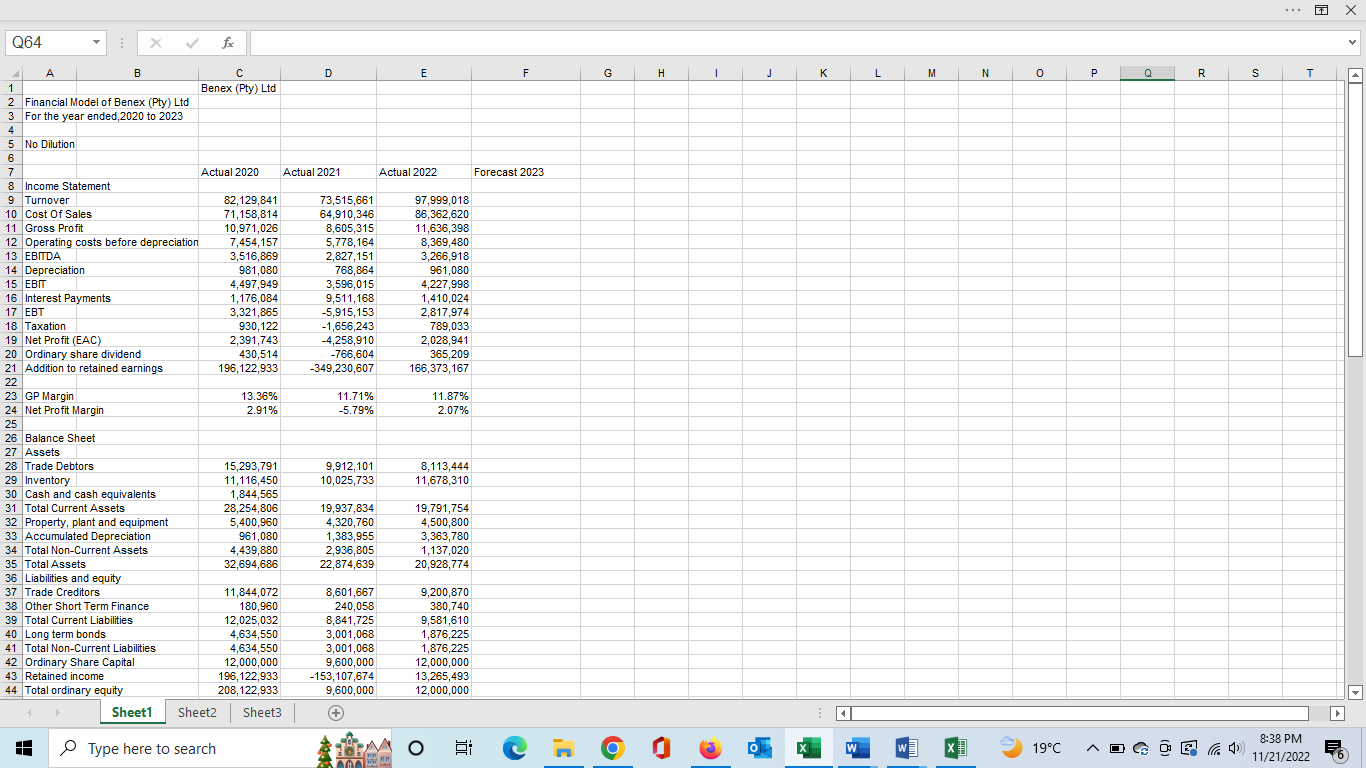

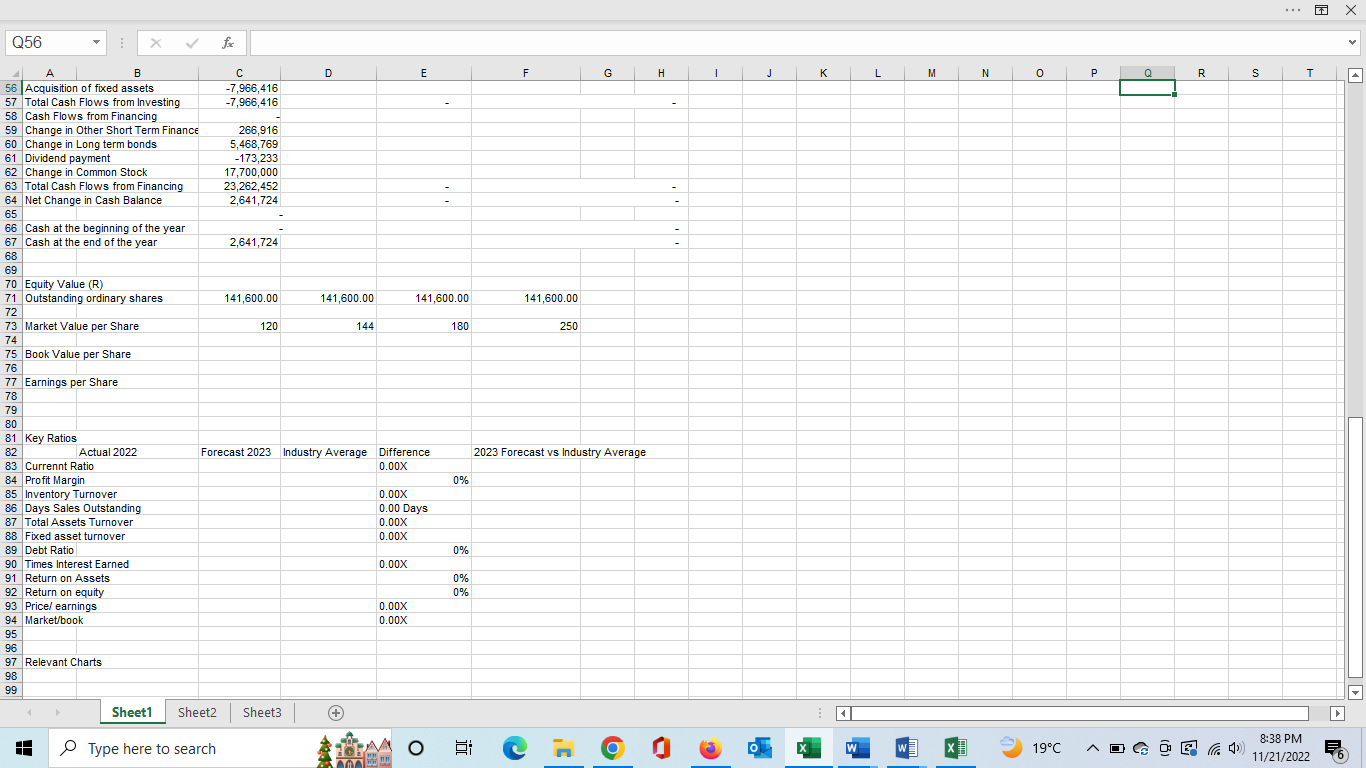
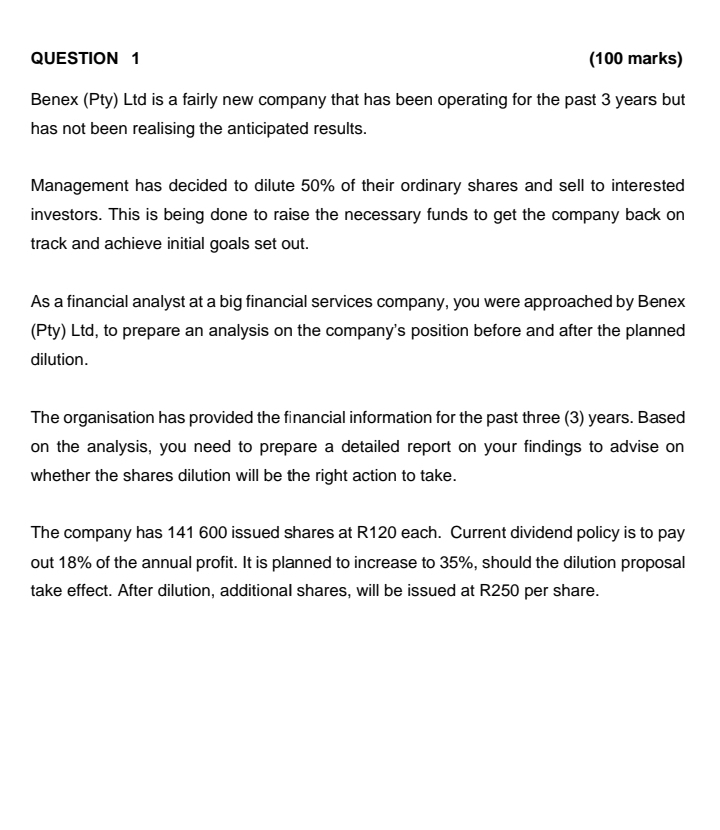


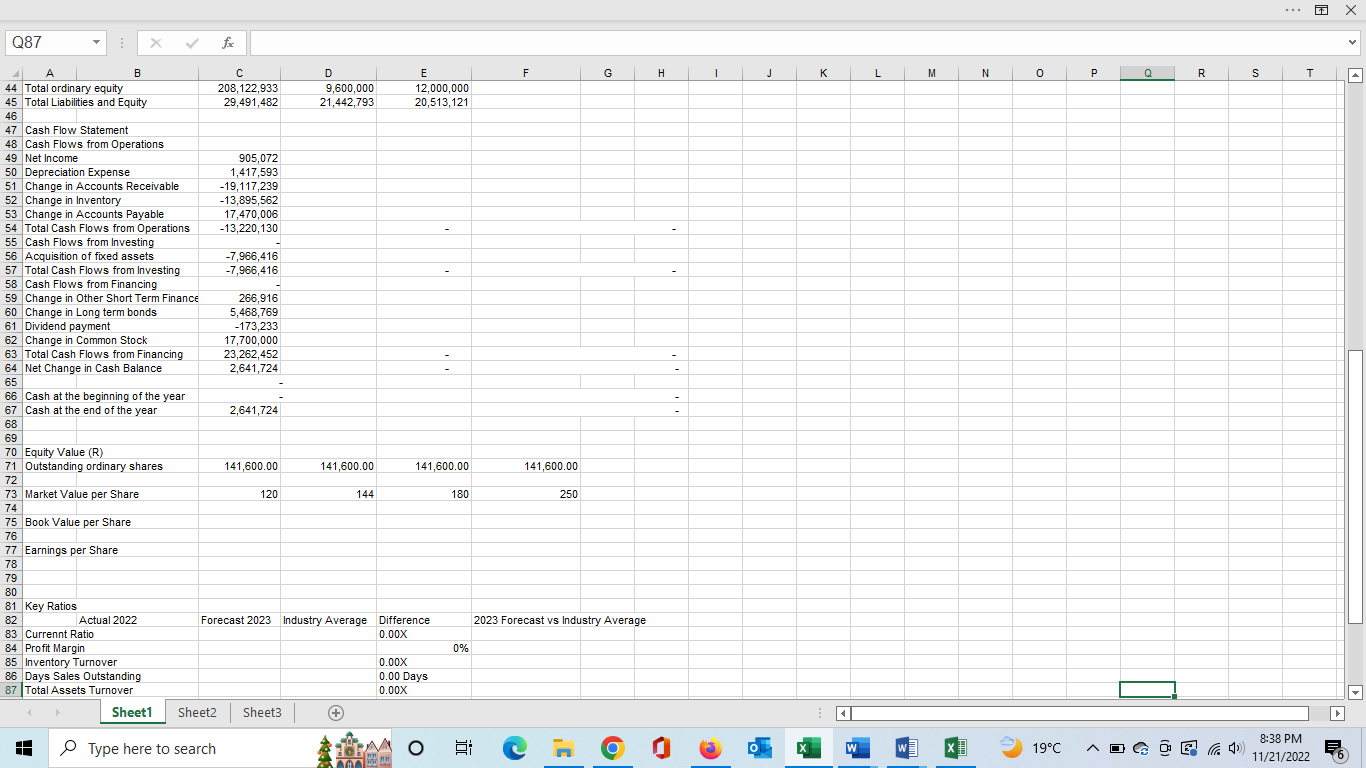


. . . G X Q64 X V A B C D E F G H I J K L M N 0 P Q R S T 1 Benex (Pty) Ltd Financial Model of Benex (Pty) Ltd For the year ended, 2020 to 2023 No Dilution Actual 2020 Actual 2021 Actual 2022 Forecast 2023 8 Income Statement 9 Turnover 82,129,841 73,515,661 97,999,018 10 Cost Of Sales 71,158,814 64,910,346 86,362,620 11 Gross Profit 10,971,026 8,605,315 11,636,398 12 Operating costs before depreciation 7,454,157 5,778, 164 8,369,480 13 EBITDA 3,516,869 2,827,151 3,266,918 14 Depreciation 981,080 768,864 961,080 15 EBIT 4,497,949 3,596,015 4,227,998 16 Interest Payments 1,176,084 9,511,168 1,410,024 17 EBT 3,321,865 -5,915,153 2,817,974 18 Taxation 930,122 -1,656,243 789,033 19 Net Profit (EAC) 2,391,743 4,258,910 2,028,941 20 Ordinary share dividend 430,514 -766,604 365,209 21 Addition to retained earnings 196,122,933 -349,230,607 166,373,167 22 23 GP Margin 13.36% 11.71% 11.87% 24 Net Profit Margin 2.91% -5.79% 2.07% 25 26 Balance Sheet 27 Assets 28 Trade Debtors 15,293,791 9,912, 101 8,113,444 29 Inventory 11,116,450 10,025,733 11,678,310 30 Cash and cash equivalents 1,844,565 31 Total Current Assets 28,254,806 19,937,834 19,791,754 32 Property, plant and equipment 5,400,960 4,320,760 4,500,800 33 Accumulated Depreciation 961,080 1,383,955 3,363,780 34 Total Non-Current Assets 4,439,880 2,936,805 1,137,020 35 Total Assets 32,694,686 22,874,639 20,928,774 36 Liabilities and equity 37 Trade Creditors 11,844,072 8,601,667 9,200,870 38 Other Short Term Finance 180,960 240,058 380,740 39 Total Current Liabilities 12,025,032 8,841,725 9,581,610 40 Long term bonds 4,634,550 3,001,068 1,876,225 41 Total Non-Current Liabilities 4,634,550 3,001,068 1,876,225 42 Ordinary Share Capital 12,000,000 9,600,000 12,000,000 43 Retained income 196,122,933 -153,107,674 13,265,493 44 Total ordinary equity 208,122,933 9,600,000 12,000,000 Sheet1 Sheet2 Sheet3 + D Type here to search O X W 19 C A D GDE(1 8:38 PM 11/21/2022 6. . . G X Q87 X V A B C D E F G H I J K L M N 0 P Q R S T 44 Total ordinary equity 208,122,933 9,600,000 12,000,000 45 Total Liabilities and Equity 29,491,482 21,442,793 20,513,121 46 47 Cash Flow Statement 48 Cash Flows from Operations 49 Net Income 905,072 50 Depreciation Expense 1,417,593 51 Change in Accounts Receivable -19,117,239 52 Change in Inventory -13,895,562 53 Change in Accounts Payable 17,470,006 54 Total Cash Flows from Operations -13,220,130 55 Cash Flows from Investing 56 Acquisition of fixed assets -7,966,416 57 Total Cash Flows from Investing -7,966,416 58 Cash Flows from Financing 59 Change in Other Short Term Finance 266,916 60 Change in Long term bonds 5,468,769 61 Dividend payment -173,233 62 Change in Common Stock 17,700,000 63 Total Cash Flows from Financing 23,262,452 64 Net Change in Cash Balance 2,641,724 65 66 Cash at the beginning of the year 67 Cash at the end of the year 2,641,724 68 69 70 Equity Value (R) 71 Outstanding ordinary shares 141,600.00 141,600.00 141,600.00 141,600.00 72 73 Market Value per Share 120 144 180 250 74 75 Book Value per Share 76 77 Earnings per Share 78 79 80 81 Key Ratios 82 Actual 2022 Forecast 2023 Industry Average Difference 2023 Forecast vs Industry Average 83 Currennt Ratio 0.00X 84 Profit Margin 0% 85 Inventory Turnover 0.00X 86 Days Sales Outstanding 0.00 Days 87 Total Assets Turnover 0.00X Sheet1 Sheet2 Sheets (+ D Type here to search O X W 19 C A D G DE(1) 8:38 PM 11/21/2022 6. . . X Q56 X V A B C D E F G H I J K L M N O P R S T 56 | Acquisition of fixed assets -7,966,416 57 Total Cash Flows from Investing -7,966,416 58 Cash Flows from Financing 59 Change in Other Short Term Finance 266,916 60 Change in Long term bonds 5,468,769 61 Dividend payment -173,233 62 Change in Common Stock 17,700,000 63 Total Cash Flows from Financing 23,262,452 64 Net Change in Cash Balance 2,641,724 66 Cash at the beginning of the year 67 Cash at the end of the year 2,641,724 68 69 70 Equity Value (R) 71 Outstanding ordinary shares 141,600.00 141,600.00 141,600.00 141,600.00 72 73 Market Value per Share 120 144 180 250 74 75 Book Value per Share 76 77 Earnings per Share 78 79 80 81 Key Ratios 82 Actual 2022 Forecast 2023 Industry Average Difference 2023 Forecast vs Industry Average 83 Currennt Ratio 0.00X 84 Profit Margin 0% 85 Inventory Turnover 0.00X 86 Days Sales Outstanding 0.00 Days 87 Total Assets Turnover 0.00X 88 Fixed asset turnover 0.00X 89 Debt Ratio 0% 90 Times Interest Earned 0.00X 91 Return on Ass 0% 92 Return on equity 0% 93 Price/ earnings 0.00X 94 Market/book 0.00X 95 96 97 Relevant Charts 98 99 Sheet1 Sheet2 Sheet3 + D Type here to search O X W 19 C A D GDE(1 8:38 PM 11/21/2022lDUES'I'IIEIN 1 [1110 marks} Benex [Pty} Ltd is a fairly new company that has been operating for the past 3 years but has net been realising the anticipated results. Management has decided to dilute Emit: of their ordinary shares and sell to interested investors. This is being done to raise the necessary funds to get the company back on track and achieve initial goals set out. As a financial analyst at a big financial services company, you were approached by Benet-t {Pty} Ltd. to prepare an analysis on the company's position before and after the planned dilution. The organisation has provided the financial information for the past three {3} years. Based on the analysis, you need to prepare a detailed report on your findings to advise on whether the shares dilution will be the right action to take. The company has 141 EDD issued shares at R1213 each. Current dividend policy isto pay out 18% of the annual profit. It is planned to increase to 35%. should the dilution proposal take effect. After dilution, additional shares. will be issued at R251] per share. 1923 t.\" .I 75%- REQUIRED: SECTION 1: (50 marks} You are presented with an Excel sheet with the required financial information. The first sheet needs to be edited to show the effect of share dilution and share sales, if completed. or not. The forecast column will thus need to be able to change the calculation between the two scenarios. Complete the following procedures on the workbook: 265 Amend the Income Statement section to show the Earnings Before Interest. Taxes Depreciation and Amortization for each year. Add a line below the last line of the Income Statement to add the Gross Profit and Net Profit Margin for each year respectively and calculate the amounts for each yeaL Add a drop-down list on the cover of the Financial Model sheet, in row 5, which can be used to navigate between the two scenarios No dilution and 50% dilution. Complete the highlighted cell on the Forecast Coefficient sheet by calculating the compound annual rate of growth in Sales by making use of the relevant Excel function. Use an Excel formula in the Forecast 2023 column to calculate the relevant line item based on the change in scenario and linking it to the Forecast Coefficient sheet. Complete the key ratio section of the Financial Model and add a column in which you need to make use of spark lines to visually compare the 2023 forecasted ratios with the industry averages, which is given on the Industry Averages sheet. Add a section which includesthe following charts: 0 A line chart to indicate the change in Net Profit Margin for the four years. Add a trend line to the chart. 0 A pie chart to indicate the split in Capital Structure. HPFM4:10-1-JuI-Dec2022-SA2-GC-Vd-26072022 Group all the different parts of the Financial Statements as well as the E ' and key ratio sections on the Financial Model Sheet. Be sure to include the following as part of Section 1's answer: Grouped view 7 Financial Model Sheet (1 mark) Normal view Scenario 1 Financial Model Sheet (15 marks) Normal view Scenario 2 Financial Model Sheet I? marks) Formula view Financial Model Sheet (21 marks) Formula view Forecast Coefficient Sheet [2 marks) Presentation and Layout (3+1=4 marks)
Step by Step Solution
There are 3 Steps involved in it

Get step-by-step solutions from verified subject matter experts