Question: G12.12 Lactation and bone loss. A study compares changes in bone density in 22 women who are neither pregnant nor breastfeeding to that of 47
G12.12
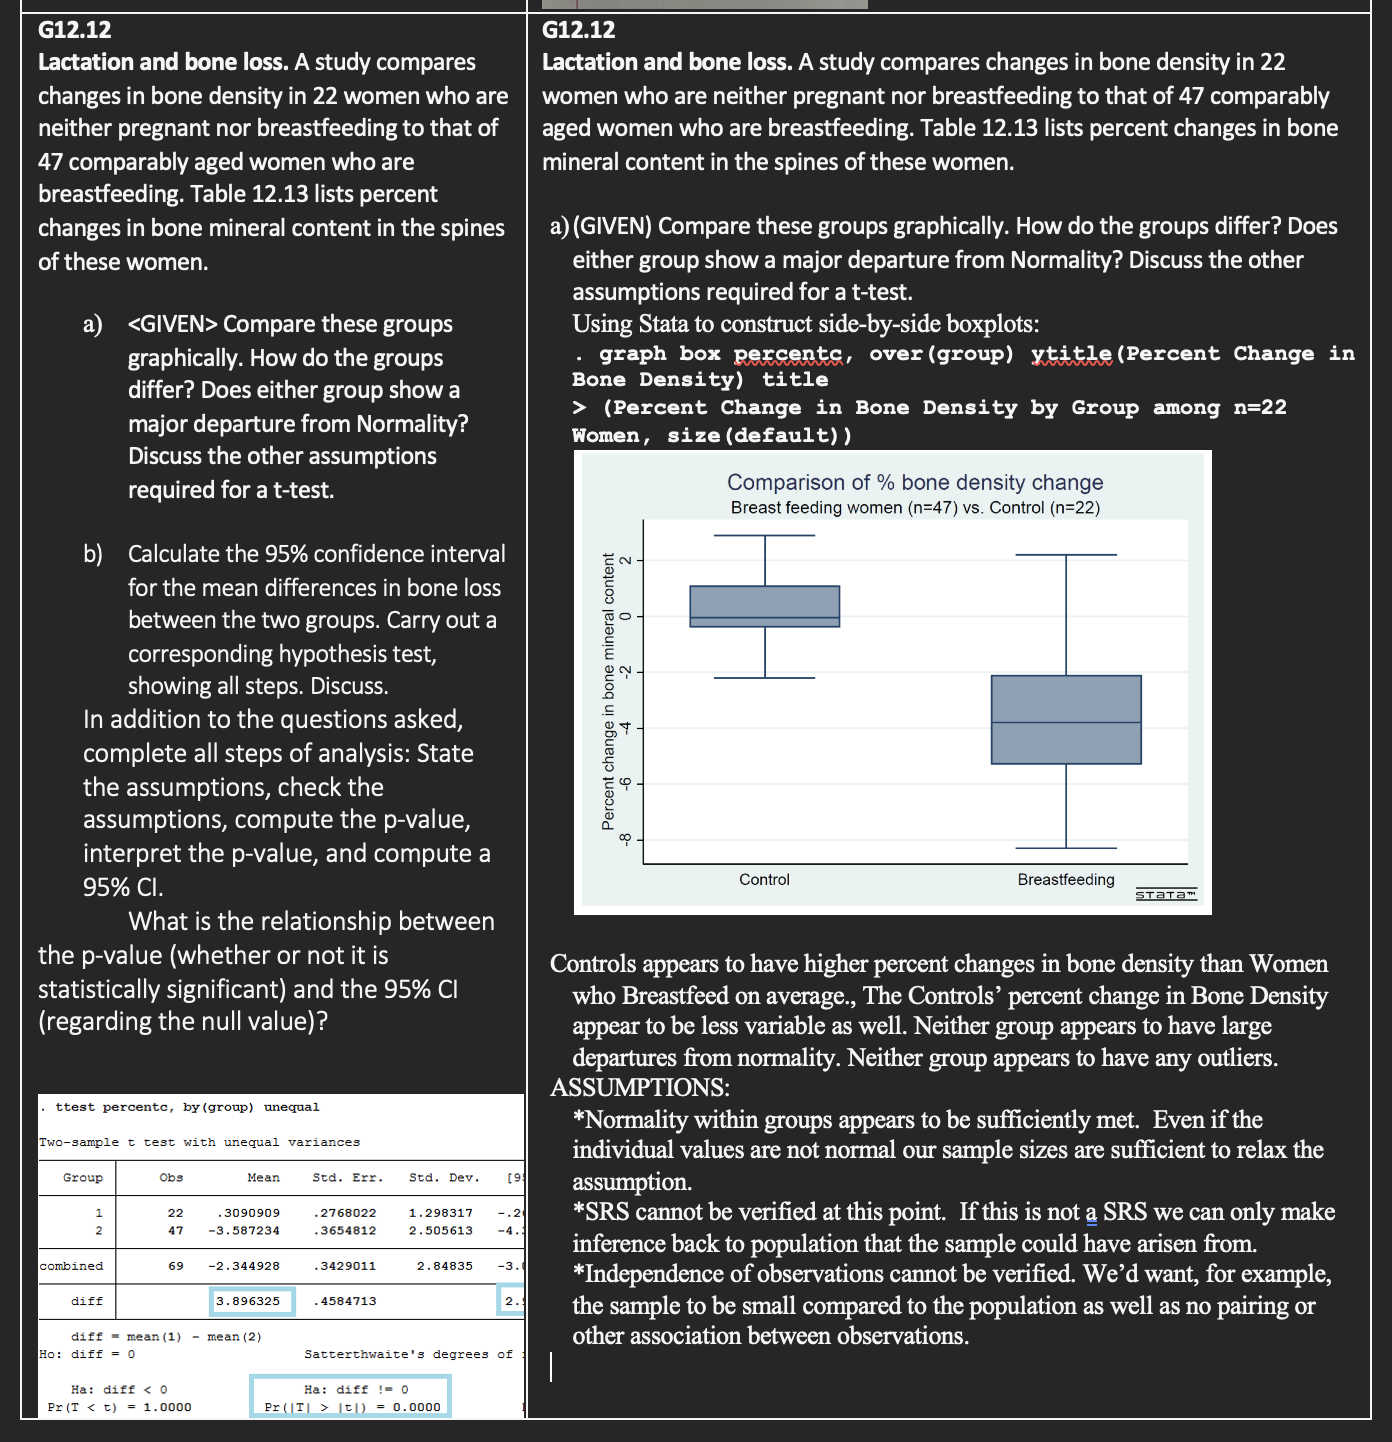
Lactation and bone loss. A study compares changes in bone density in 22 women who are neither pregnant nor breastfeeding to that of 47 comparably aged women who are breastfeeding. Table 12.13 lists percent changes in bone mineral content in the spines of these women.
Compare these groups graphically. How do the groups differ? Does either group show a major departure from Normality? Discuss the other assumptions required for a t-test.
Calculate the 95% confidence interval for the mean differences in bone loss between the two groups. Carry out a corresponding hypothesis test, showing all steps. Discuss.
State the assumptions, check the assumptions, compute the p-value, interpret the p-value, and compute a 95% CI.
What is the relationship between the p-value (whether or not it is statistically significant) and the 95% CI (regarding the null value)?
Hypotheses?
H0:
HA:
Results and Stata output?
Interpretation?
Decision?
CI Interpretation?
Relationship between CI and p-value?
G12.12 G12.12 Lactation and bone loss. A study compares Lactation and bone loss. A study compares changes in bone density in 22 changes in bone density in 22 women who are women who are neither pregnant nor breastfeeding to that of 47 comparably neither pregnant nor breastfeeding to that of aged women who are breastfeeding. Table 12.13 lists percent changes in bone 47 comparably aged women who are mineral content in the spines of these women. breastfeeding. Table 12.13 lists percent changes in bone mineral content in the spines a) (GIVEN) Compare these groups graphically. How do the groups differ? Does of these women. either group show a major departure from Normality? Discuss the other assumptions required for a t-test. a) Compare these groups Using Stata to construct side-by-side boxplots: graphically. How do the groups graph box percentc, over (group) ytitle (Percent Change in differ? Does either group show a Bone Density) title major departure from Normality? > (Percent Change in Bone Density by Group among n=22 Women, size (default) ) Discuss the other assumptions required for a t-test. Comparison of % bone density change Breast feeding women (n=47) vs. Control (n=22) b) Calculate the 95% confidence interval for the mean differences in bone loss between the two groups. Carry out a corresponding hypothesis test, showing all steps. Discuss. Percent change in bone mineral content In addition to the questions asked, complete all steps of analysis: State the assumptions, check the assumptions, compute the p-value, interpret the p-value, and compute a 95% CI. Control Breastfeeding STaTam What is the relationship between the p-value (whether or not it is Controls appears to have higher percent changes in bone density than Women statistically significant) and the 95% CI who Breastfeed on average., The Controls' percent change in Bone Density regarding the null value)? appear to be less variable as well. Neither group appears to have large departures from normality. Neither group appears to have any outliers. ASSUMPTIONS: ttest percentc, by (group) unequal *Normality within groups appears to be sufficiently met. Even if the Two-sample t test with unequal variances individual values are not normal our sample sizes are sufficient to relax the Group Obs Mean Std. Err. Std. Dev. 19 assumption. 22 . 3090909 . 2768022 1. 298317 17 . 3654812 2.505613 -4 *SRS cannot be verified at this point. If this is not a SRS we can only make -3. 587234 inference back to population that the sample could have arisen from. combined 59 -2. 344928 . 3429011 2. 84835 -3 . *Independence of observations cannot be verified. We'd want, for example, liff 3. 896325 4584713 2 . the sample to be small compared to the population as well as no pairing or diff = mean (1) - mean (2) other association between observations. do: diff = 0 Satterthwaite's degrees of Ha: diff It|) = 0.0000b) Calculate the 95% confidence interval for the mean differences in bone loss between the two groups. Carry out a corresponding hypothesis test, showing all steps. Discuss. In addition to the questions asked, complete all steps of analysis: State the assumptions, check the assumptions, compute the p-value, interpret the p-value, and compute a 95% Cl. What is the relationship between the p-value (whether or not it is statistically significant) and the 95% CI (regarding the null value)? Hypotheses: Ho: HA: (Checked assumptions above) Results and Stata output Interpretation: Decision: CI Interpretation: Relationship between CI and pvalue
Step by Step Solution
There are 3 Steps involved in it
1 Expert Approved Answer
Step: 1 Unlock
Question Has Been Solved by an Expert!
Get step-by-step solutions from verified subject matter experts
Step: 2 Unlock
Step: 3 Unlock
Students Have Also Explored These Related Mathematics Questions!