

Question: Gantt chart program writing Process id Service time Arrival time 1 7 5 0 2 4 0 1 0 3 2 5 1 0 4
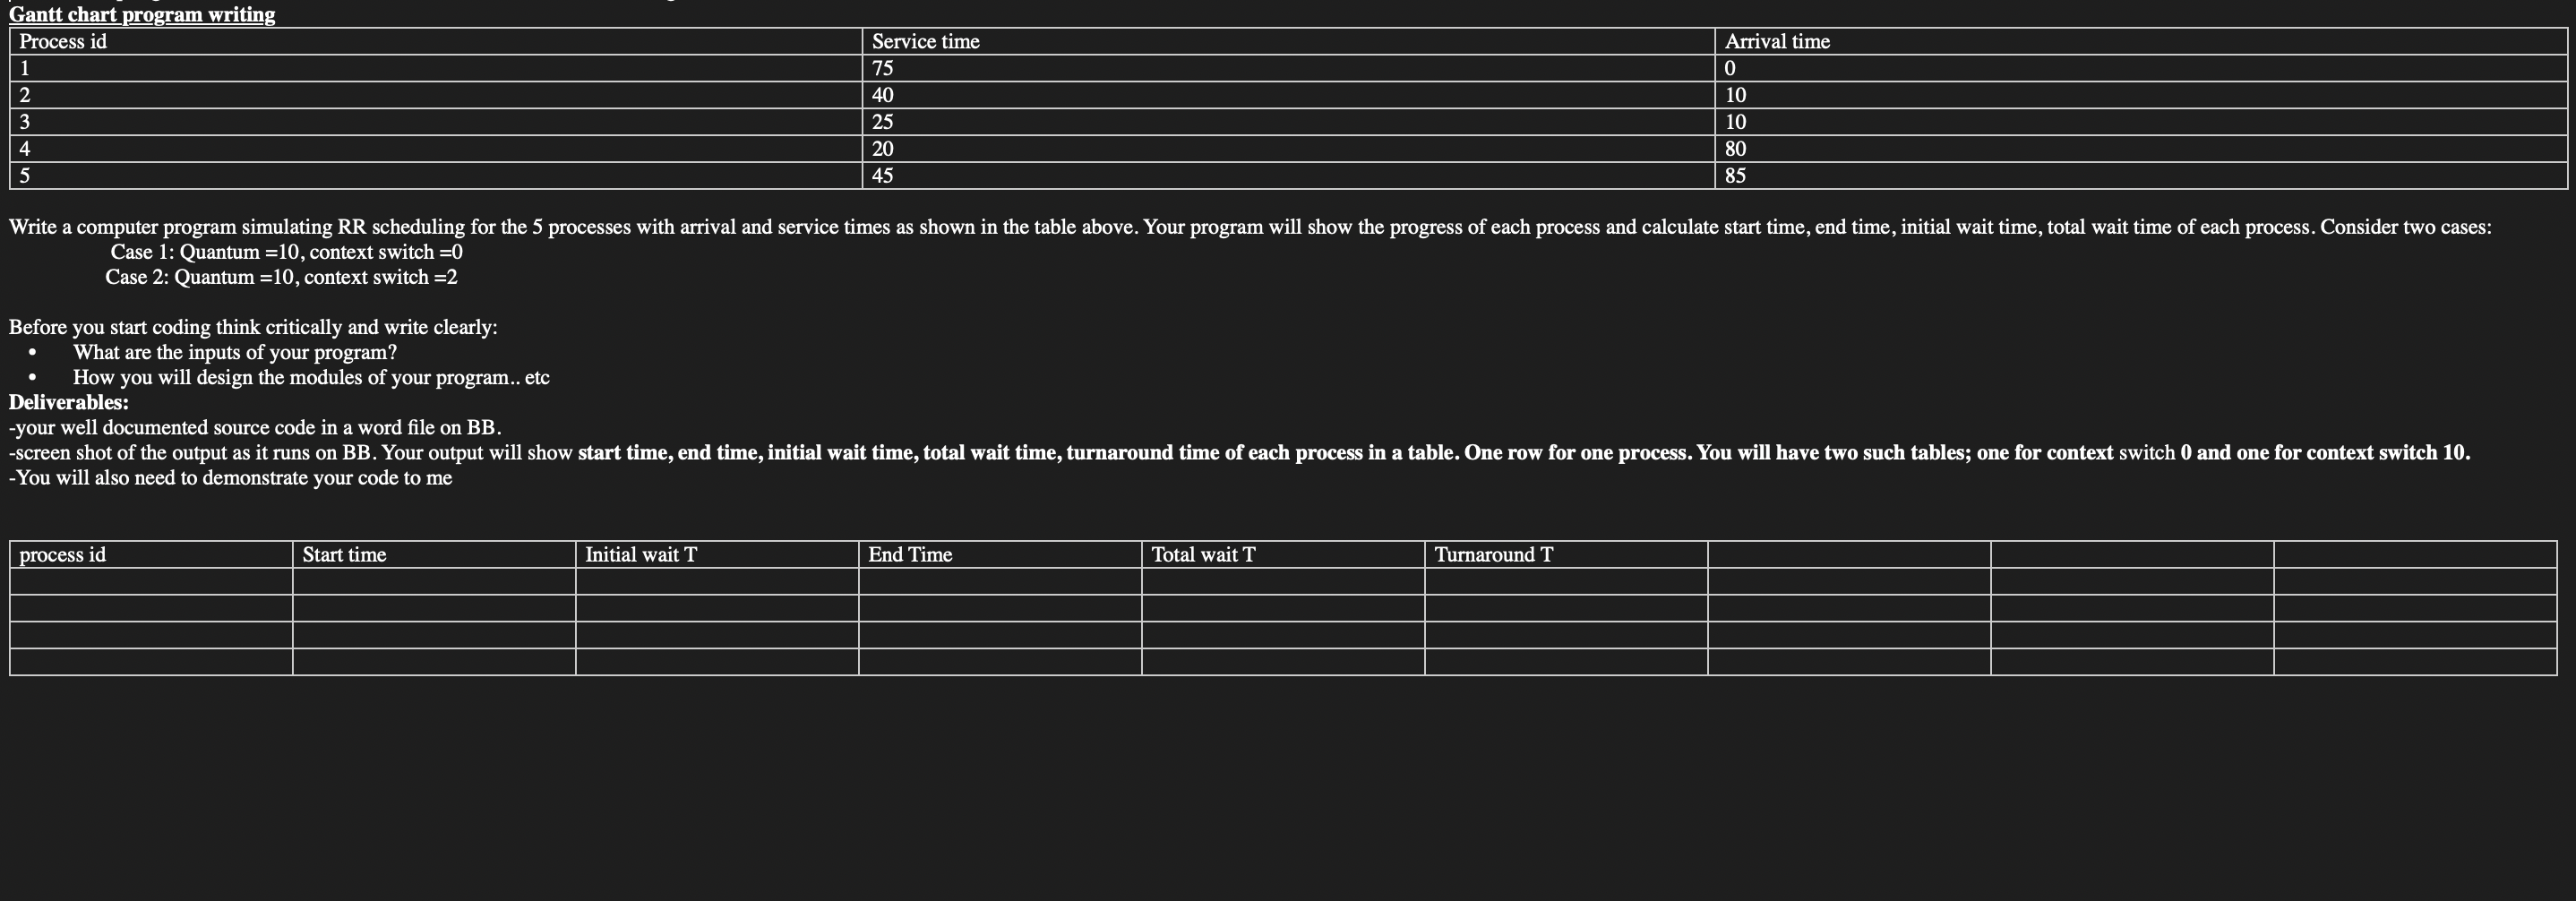
Gantt chart program writing Process id Service time Arrival time Write a computer program simulating RR scheduling for the processes with arrival and service times as shown in the table above. Your program will show the progress of each process and calculate start time, end time, initial wait time, total wait time of each process. ConsideCase : Quantum context switch
Case : Quantum context switch
Before you start coding think critically and write clearly:
What are the inputs of your program?
How you will design the modules of your program.. etc
Deliverables:
your well documented source code in a word file on BB
You will also need to demonstrate your code to mer two cases: Case : Quantum context switch Case : Quantum context switch Before you start coding think critically and write clearly: What are the inputs of your program? How you will design the modules of your program.. etc Deliverables: your well documented source code in a word file on BBscreen shot of the output as it runs on BB Your output will show start time, end time, initial wait time, total wait time, turnaround time of each process in a table. One row for one process. You will have two such tables; one for context switch and one for context switch You will also need to demonstrate your code to me process id Start time Initial wait T End Time Total wait T Turnaround T
Step by Step Solution
There are 3 Steps involved in it
1 Expert Approved Answer
Step: 1 Unlock

Question Has Been Solved by an Expert!
Get step-by-step solutions from verified subject matter experts
Step: 2 Unlock
Step: 3 Unlock